In 1963, Joe Granville showed the world for the first time a new indicator in his book Granville's New Key to Stock Market Profits. The indicator is called On Balance Volume, or OBV for short.
This indicator follows the ideal that volume will precede trend. If you follow the trail of where the big money is heading, you are likely to experience a price appreciation also.
What Makes the On Balance Volume Tick?
To understand how OBV works, we need to understand a few principles that it is based on. First, we will add the volume on up days and compare them to the volume on down days. The net difference is On Balance Volume.
If the stock rose for 10 days with an average volume of one million shares per day and the stock fell for 10 days with an average daily volume of only 800,000 shares, the OBV would show a positive value regardless of whether the share price is overall up or down. More money is flowing into the positive days than the negative days.
But what is an up day versus a down day and why do we care? OBV is very similar to another tool, Accumulation and Distribution. There is one key difference: how an up day is calculated. OBV calculates an up day as one that closes higher than the previous day. Accumulation and Distribution says that only today matters; if the stock rose today it doesn’t matter what happened yesterday. Uhhh… you lost me, how are they different?
If the stock ga this as negative. One compares between days and the other only looks at today’s data. Compare a chart with both signals and you will see how similar they are until a gap occurs.
Viewing the On Balanced Volume on a Chart
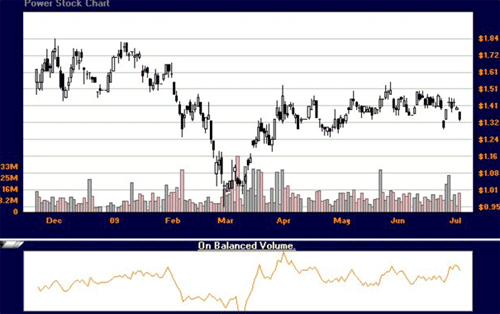
Most charting software will display the OBV line only, without the ability to plot a moving average. Generally, the OBV line will closely mimic the stock price. The chart below depicts the stock ITO trading in a normal pattern with the OBV line looking very similar to the price action.
ITO with the On Balance Volume indicator

There are a few ways to profitably trade the OBV: divergence and crossovers.
Trading the OBV for Divergence and Crossovers Strategy
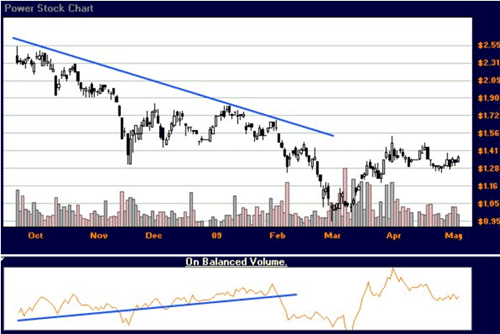
The first trading signal is divergence. If the OBV is moving lower despite the stock prices moving higher, this means that volume is not behind the trend making it highly susceptible to a crash. However, if the OBV trades up while the stock trades down, someone is accumulating this stock and it is likely to move upwards.
Keep in mind, divergences rarely pinpoint the reversal. They are much better at telling you that an overall trend is losing steam and may reverse. Other tools are needed for the precise entries and exits.
ITO with divergent signals from OBV and price

For instance, the above chart showed a long time accumulation of the stock ITO despite falling prices. After a low of around one dollar, prices did rise 50 percent to trade in a choppy fashion. A discontinued downtrend does not always directly equate into an uptrend. A sideways trading often follows a trending market.
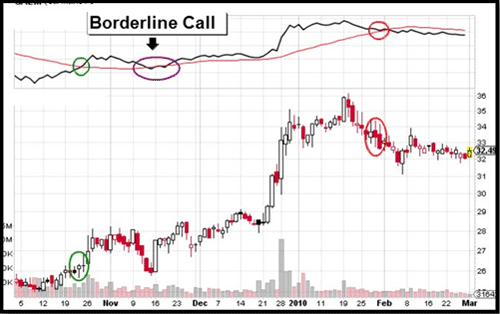
The second trading signal is an OBV crossover with an OBV moving average. Only some charting software will allow you to do this. If you are simply not able to use OBV with a moving average, switch to the Money Flow Index for a similar although not exact result.
Here are the signals using a 28 period moving average for long term trading and 14 periods for shorter term trading:
- When OBV rises above its moving average you buy
- When OBV falls below its moving average you sell
The following chart will show some signals generated using the longer term periods of 28. The green circles mean buy and the red circles mean sell.
Chart with On Balance Volume crossovers on 28 day moving average

Trading the On Balance Volume with Other Indicators
Whether you use OBV to spot divergences in prices, or to play smaller volume breakouts, this tool is best used in conjunction with other tools. We will discuss that later in the strategy section. Apparently though, validating prices with volume is both powerful and simple at the same time.