At the heart of the last global crises and the current Eurozone woes, is the banking industry. Is now a fine time to invest in banking shares? If so, which of these companies well positioned fundamentally?
Banking Leverage
Banks use leverage to increase profitability beyond what would be possible if they simply invested or loaned out dollar for dollar of deposits. While this can enhance profits, it can work against them when they need to raise cash or when losses mount against them. While figuring this out can be complex, a simple analysis of the leverage ratio should show us which banks have lower leverage and less associated risk.
- Industry Average Leverage: 14.2
- ANZ: 15.3
- CBA: 18.2
- NAB: 17.3
- WBC: 15.5
With leverage ratios quite similar there is no-one massive winner, although ANZ and WBC get points for being slightly lower. They all get commendation for being below higher ratios around the world that are more than double this.
Banking Debt to Equity Ratios
A bank is constantly trying to balance loans and assets for the perfect ratio. While they make more money if they loan it all out, this can create liquidity problems when cash is necessary. Too much cash and their money is lying dormant – not earning them profit.
The debt to equity ratio is used differently in non-banking stocks since banks calculate debt differently than to other corporations. However, a quick analysis of the debt-to-equity ratios should give us some idea which of the banks have higher, and thus less desirable, ratios.
- Industry Average Leverage: 2.95
- ANZ: 2.0
- CBA: 3.86
- NAB: 2.43
- WBC: 5.21
In this match-up, ANZ and NAB get points for having a lower debt to equity ratio.
Historical and Future Growth
When investing we look for future growth prospects to ensure the safety of our dividend and for future capital share price gains. How do these 4 banks stack up?
| BANK | 1 YR SALES GROWTH | 5 YR AVG SALES GROWTH | 1 YR EPS GROWTH | 5 YR EXPECTED EPS GROWTH |
|---|---|---|---|---|
| ANZ | 1.2% | 8.47% | 34.80% | 20.22% |
| CBA | 15.8% | 13.55% | 11.5% | 9.15% |
| NAB | -4.1% | 7.16% | 55.6% | 25.85% |
| WBC | 12.2% | 17.05% | 68.10% | 7.63% |
Once again we have a mixed bag. CBA and WBC have the highest 1 year sales growth but it is ANZ and NAB that have the highest forward looking earnings growth. The companies with the strongest track record of sales and earnings growth are CBA and WBC so we need to consider historical proof as well.
Banking Price Performance
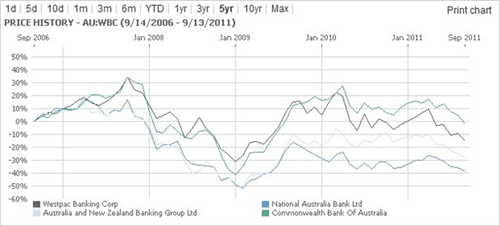
As we consider price performance, we will include 5 years of data to show the effects of the last financial meltdown.

The strongest performer is CBA with WBC trailing closely behind on the 5 year chart. The bottom performing bank stocks are NAB followed by ANZ. This is no surprise as we just finished showing that CBA and WBC had the strongest performing 5 year record. In general though, you can see these stocks trading in packs.
Dividend Yields
The picture is staring to firm up, but we need to consider dividend yields and the payout ratio before a final winner is announced.
- ANZ – 6.92% yield with 60% payout ratio
- CBA– 6.75% yield with 78% payout ratio
- NAB – 6.95% yield with 81% payout ratio
- WBC – 7.45% yield with 60% payout ratio
WBC comes out on top as having the highest yield with the lowest payout ratio – both of which are positive aspects of dividend investing.
The Banking Winner?
While all of these banking stocks have their strong points, the title belt goes to WBC. Not only did it fare the best as to price performance and consistent growth over the past 5 years, but they also offer the most attractive dividend yield of the 4 shares. Their banking leverage is among the lowest of the 4. While their 5 year earnings growth seems a bit on the low side, I have high hopes for WBC as a well-rounded and top-performing bank stock that has already stronger defences in this financial ‘survival of the fittest’.