When you track the S&P 500 index (or whatever your commonly used local index is) you get a clear picture of what the broad market is doing. For many years traders have watched a popular index or index futures when deciding whether to buy or sell intra-day. The mass market influence is great and can pump prices up or hold them down so taking note of market-wide action is prudent.
You need to understand though that some of your stocks will lead the index and others will lag while others will not trade with it at all – that is the nature of the relationship between an index and the constituents.
For example, if you have 500 stocks, 100 of them might be very strong and leading the index. Another 300 might trade in step with the market average and another 100 weak firms have a small lag behind the index. It all depends on whether the market is going up or down. Weak stocks will be more reluctant to go up and quicker to drop as a general rule.
How should you use the market-tracking ETF? I like keep it simple. I track the SPY (but use whatever index is common in your area) on a 5 minute candlestick chart with the same techniques as mentioned throughout this manual. When you see the SPY break a trend or begin a new trend – this is signal to form a bias.
However this is not an immediate signal to exit your position as if the market is the ultimate dictator for buying and selling. View anything that the market does as pressure or force or to enhance your stock specific bias. The amount of weight you place on the index will be determined by numerous factors and you’ll quickly be able to discern this after watching the market and trading the stock for a short period of time.
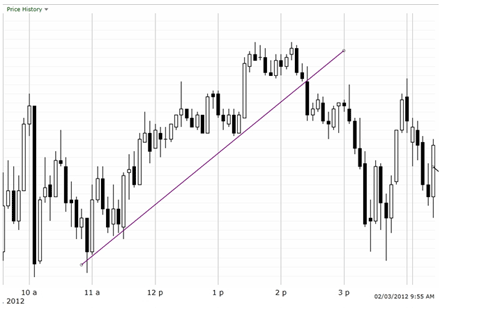
The chart above is for the SPY which tracks the S&P 500. At 2:25 the market starts to break down and the trend is broken. How will this affect our other trades? Let’s look at a few stocks to see how they reacted on that same day.
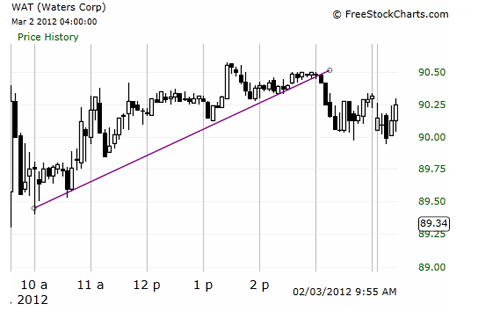
Shares of WAT stayed strong and only broke down at 3:05 which was 40 minutes after the market choked.
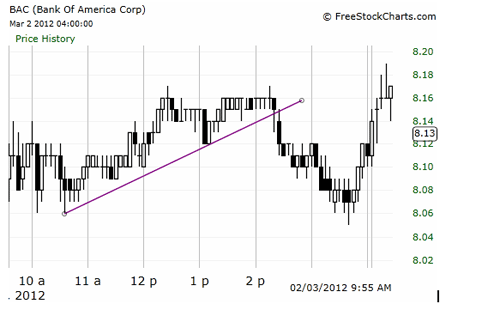
The Bank of America broke the trend 5 minutes before the market did.
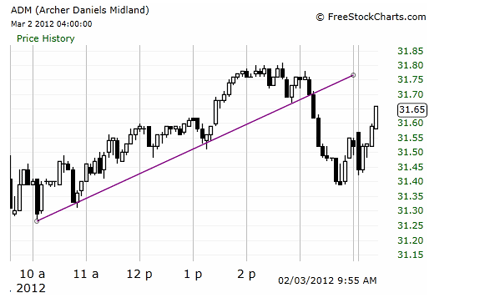
Shares of Archer Daniels did have a drop at 2:25 but prices held up until 3:15.
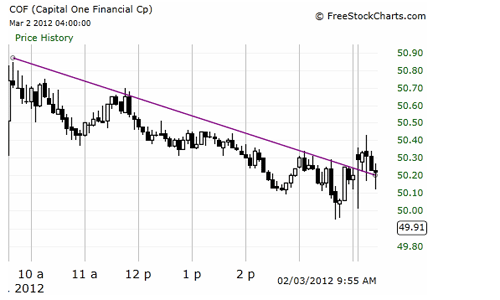
Shares of Capital One (COF) were in a downtrend already so the 2:25 breakdown of the market did not have the same effect that it had on stocks closely tracking the market.
You will usually find that stocks reacting to earnings or news items will not follow the market as closely as another stock with no news that listlessly trades up and down with its peers. In general, you should always have a 5 minute chart of the most common index on your screen. Every 15 minutes or so you should re-examine the index with your trendlines and re-consider where the market might be heading. When the market starts to break down, begin tightening up your selling rules for any long positions. The market is a powerful force and any good trader should pay heed to where the winds are pushing the individual stocks.