Academy
  • Log in
  • Sign up
  • StockWatch
  • Lobby
  • Academy
  • Investing
    • Planning Your Investments Setting investment goals
    • 8 Steps to Financial Freedom
    • How to Get Out of Debt
    • Dollar Cost Averaging with Example Calculations
    • Which Credit Card Should I Get?
    • Can I Retire on 1 Million Dollars? Is it Enough?
    • Investment Vehicles Best way to invest your money?
    • How to Budget Your Money
    • Choosing a Finance Advisor
    • Asset Classes: Shares, property, fixed interest
    • The Magic of Compound Interest
  • Shares
    • Stock Market Investing and Share Market Tips
    • Short Selling Explained: What is Short Selling
    • How to Trade Like a Professional Trader
    • What are E Minis Futures? How do I Trade Them?
    • Diversification Learn how to diversify your portfolio
    • What Is Ethical Investing?
    • Creating a Trading Plan
    • The S&P/ASX 200 Index (XJO)
    • Choosing A Broker
    • Guard Your Portfolio With Defensive Stocks
    • How Much Do I Need To Invest In Shares
    • Investing VS Trading
    • What does ex dividend mean? How to ensure you receive your dividends
    • If I Could Only Invest In One Thing...
    • What Are Shares Dividends?
    • Dividend Imputation System & Franking Credits Explained Calculations
    • What is the 'Market'?
    • What Shares Should I Buy?
    • How to Buy Shares, placing an order
    • Building a Investment Portfolio Strategy
    • Trading the ASX 200 Index: ETFs, CFDs, Futures and Options
    • Creating a Trading System
    • Understanding the Share Language & Jargon of the Share Market
    • What are Income Stocks? Best Income Stocks for 2010
    • How To Pick Growth Stocks?
    • Wesfarmers (WES) vs Woolworths (WOW)
    • David Jones (DJS) VS Myer (MYR)
    • Benefits of Investing in Shares
    • How to Make Money In Shares
    • How to Treat Trading Like a Business
    • BHP vs RIO
    • Making Money In a Bear Market
    • Investing in Cloud Computing Stocks
    • High Dividend Stocks
    • Make Money Trading the Share Market
    • ANZ vs CBA vs NAB vs WBC
  • Funds
    • Managed Funds Choosing the best fund for you
    • S&P/ASX 200 ETFs: STW, IOZ, VAS
    • Managed Funds or Direct Shares
    • ETFs (Exchange Traded Funds)
    • Introduction to Index Funds
    • ETF Trading
  • Fundamental Analysis
    • Fundamental Analysis of Stocks: Qualitative Factors of the Company
    • Fundamental Analysis of Stocks: Qualitative Factors of the Industry
    • Fundamental Analysis: Quantitative Factors, Book and Price to Book Ratio
    • Fundamental Analysis: Quantitative Factors, Earnings Per Share (EPS)
    • Fundamental Analysis: Quantitative Factors, Price to Earning (P/E) and PEG
    • Fundamental Analysis: Quantitative Factors, Short Interest
    • Warren Buffett: A genius investor, a philanthropist, and a role model for citizens
    • Benjamin Graham: Father of value investing
    • Phillip Fisher
    • Peter Lynch
  • Technical Analysis
    • Charting
      • Technical Analysis: Charting: Line Chart
      • Technical Analysis: Charting: Bar Chart
      • Technical Analysis: How to Read a Candlestick Chart
      • Technical Analysis: How to Read Point and Figure Charts
      • Technical Analysis: How to Draw Trend Lines On A Stock Chart
      • Technical Analysis: What are Stock Gaps & How to Trade Them
      • Technical Analysis: How to Read & Trade Chart Patterns
    • Technical Analysis: The Secret of Moving Averages Explained
    • Learn How To Trade Support and Resistance Levels
    • Technical Analysis Indicators: Leading versus Lagging Indicators
    • Trend Following Indicators Part 1: What Is a Trend?
    • Trend Following Indicators Part 2: Trading The Average Directional Index (ADX)
    • Trend Following Indicators Part 3: The Directional Movement Index (DMI)
    • MACD Indicator Explained
    • Technical Analysis Momentum Indicators: ROC, Stochastic & RSI
    • The Relative Strength Index RSI Indicator Explained
    • Stochastic Indicator Explained
    • Momentum Following Indicators: The TRIX Indicator
    • Volume Following Indicators In Technical Analysis
    • Volume Indicators: On Balanced Volume (OBV) Indicator
    • Volume Indicators: Money Flow Index (MFI) Indicator Explained
    • Volume Following Indicators: Percentage Volume Oscillator (PVO) Indicator
    • Technical Analysis: Parabolic Stop and Reversal (PSAR) Indicator
    • Technical Analysis: Stop Loss & Trailing Stop Loss Orders
  • Commodities
    • Should I Invest in Gold? Pros and Cons of Precious Metal Investing
    • Should I Buy Gold Now?
    • Investing In Silver 7 Methods to Gain Exposure to Silver
  • Day Trading
    • Common Day Trading Myths and Lies Debunked
    • Day Trading Rules Part 1: Setup Long
    • Day Trading Rules Part 2: Setup Short
    • Buying and Selling With the Trend
    • Day Trading: The Art of Controlling Your Emotions Part 1
    • Day Trading: The Art of Controlling Your Emotions Part 2
    • Intermediate Setups and Creating a Bias Part 1
    • Intermediate Setups and Creating a Bias Part 2
    • The Art of Channel Trading
    • Day Trading Example: Walking Through a Trade – Part 1
    • Day Trading Example: Walking Through a Trade – Part 2
    • Can I Make Money Day Trading? How to Become a Day Trader?
    • Tracking the Market and Day Trading Your Stock
    • High Frequency Trading
    • What is a Trading Robot? Should I Use One to Trade?
  • Forex
    • How to Trade FOREX – Beginners Guide
    • Trading Forex
  • Derivatives
    • Options
      • Options Trading: Call Options Explained
      • Options Trading: Put Options Explained
      • Options Trading: Why Trade Options?
      • Components of an Option
      • Understanding Option Pricing Fundamentals
      • Options Trading Examples
      • Options Trading Strategies
      • Options Trading Risks
      • The Covered Call Strategy
      • Trading Options Seminars: What You Will Learn in a Teaser Seminar
    • CFDs
      • What are CFD's? Why Trade them?
      • CFD Types: Direct Market Access (DMA) VS Market Maker (MM) The Pros & Cons
      • CFD Margin Requirements Initial and Variation Margin.
      • CFD Trading: Calculating Overnight Interest Payments (Financing fees) with example
      • CFD Trading: CFD real life examples with calculations (Long & short)
      • The Pros & Cons of Trading CFDs
      • CFD Trading Risks: Learn the risks associated with trading CFDs
      • How to Choose the Best CFD Provider for You
      • CFD Trading Top 5 Trading Mistakes
      • CFD Tax Treatment
      • Learn How To Trade CFDs: Developing a system that should make us money
      • CFD Trading Example Flight Centre (FLT)

Technical Analysis: Stop Loss & Trailing Stop Loss Orders

  1. Articles
  2. Technical Analysis
  3. Stop Loss
11 February 2011
ยท
4 min read

Using Stop Loss Orders

The weakness of most trading systems is the lack of attention to an exit. No doubt many of you have seen charts with cute green arrows showing amazing entry points IF the trader profited out at the succeeding peak. More often than not, the trader has no other exit strategy than his gut. The trader could be in a profitable position, but suddenly feels that the stock will keep on rising. As the price reverses and the profits dwindle, they promise to sell if prices just goes back up to a former high.

One of two things may happen: the trader either marries the loss riding it for many years in the gutter, or he sells at a breakeven point. Neither scenario will make the investor money if he doesn’t have a proper exit strategy.

Aristocrat Leisure (ALL) price chart

Aristocrat Leisure (ALL) price chart

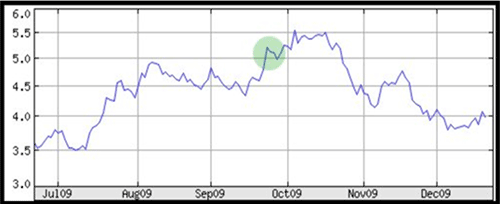
Buying at 5 dollars could be a profitable entry depending on the exit strategy.

Two Flavors of a Stop-Loss

There are a variety of methods to exit a stock. Usually, the more complex or subjective an exit strategy is, the more opportunity the trader has to talk himself into a losing position. A couple of very clear-cut methods exist to profit out on a stock and it requires little interpretation.

  • Parabolic Stop and Reversal
  • Trailing Stop Loss

Another article is dedicated to the PSAR tool. In brief, it is a trailing stop-loss of sorts that tightens over time. The indicator is based on trend and momentum and provides a decent short-term exit strategy.

The Trailing Stop Loss Technique

The concept of the trailing stop-loss is very basic. If you are long in a stock, a sell order is placed a certain percentage below the current share price. If you are short in a stock, the cover order is placed a specified distance above the current value. The trailing stop loss will move in one direction but not the other.

For instance, you buy stock ABC at 10 dollars and set a trailing sell order 10 percent below the share price. Your sell order is at 9 dollars. If the stock ABC falls in value, the sell order holds at 9 dollars until triggered. If the stock moves up, so does the trailing stop-loss. If the stock were to rise to 20 dollars, the trailing stop-loss would be at 18 dollars or 10 percent below current price.

The advantages or the trailing stop-loss are apparent:

  • Emotionless selling
  • Locked in minimum profits (once stop-loss rises above the buy in price)
  • Protection against falling prices if away from trading station

What considerations need to be made as regards where to set the trailing stop-loss? Should it be 1 or 20 percent below your buy price?

Setting the Trailing Stop Loss Wisely

Before setting the stop-loss, you need to look at your trading style. If you are a buy and hold investor it is unlikely that you will be setting a tight stop-loss of a few percent. If you are a trader that likes to hold for a few days at a time, your stop-loss will have little tolerance for wide swings.

Let us consider a couple of examples:

One famous investor, William O’Neil, recommends having a stop-loss order or 7 to 8 percent below your buy in value. Should you buy and the stock immediately tank, this stop-loss will help you exit before getting into a grudge match with the stock.

Some investors take this rule one step further and use it as a trailing stop-loss. This would be for a trader that can trends that last weeks to months and may rise in excess of 20 percent during this time period.

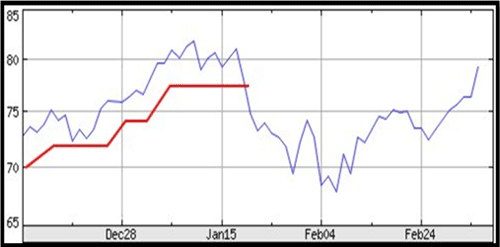
Below is a crude example of what a 5 percent trailing stop loss would look like on a chart. The blue line is the price of BHP while the red line shows the trailing stop that rises when the stock does, but remains in place to profit out if the stock falls 5 percent.

BHP with roughly 5 percent trailing stop loss order

BHP with roughly 5 percent trailing stop loss order

Short term traders that trade for days to weeks, or CFD and options traders will likely find a stop-loss of 7 to 8 percent to be too wild and loose to maintain profits. They will often have a stop-loss as tight as one or two percent. Truth be told, day traders are at their terminals during open exchange hours so most will not even use stop-losses. Especially is this true from scalpers or micro-traders that might only be in a position for a few seconds.

Stop-loss orders are usually not calculated intra-day but between days. If you purchased a stock intraday at 10 dollars and it fell to 5 dollars (as unlikely as that may seem), many trailing stop-loss programs would not pick up on it.

  • Very long term investors = stop-loss of 10 – 20 percent
  • Medium term investors = 7 – 8 percent stop loss
  • Short term investors = 1 or 2 percent, or none at all

Setting Absolute Stops

In addition to a sliding stop-loss order, there are times when you want to place an absolute stop order. This is true when a stock is near a support or resistance level. Although you may have a 7 or 8 percent sliding stop-loss order, you might also sell if the stock breaks down below the support.

Other times you want an absolute stop-loss order is if you buy after a momentum or trend breakout, as well as reversal plays. While these might be highly profitable at times, a failed breakout can quickly erode profit and capital. Placing a stop below these key points is something to consider.

Final Word on Stop-Loss Orders

Having an exit strategy is vital to the success of any trader. While a variety of methods exist to exit from fundamental to technical indicators, a trailing stop-loss is a simple and proven method to capture gains.

technical analysis
You May Also Like
  • Learn How To Trade CFDs: Developing a system that should make us money
  • Creating a Trading Plan
  • Make Money Trading the Share Market
  • Technical Analysis: Parabolic Stop and Reversal (PSAR) Indicator
  • How to Trade Like a Professional Trader
About Privacy Contact v2.0.1
© 2025 The Domain Publisher Pty Ltd.
This website uses cookies to ensure you get the best experience on our website. Learn more about cookies