Academy
  • Log in
  • Sign up
  • StockWatch
  • Lobby
  • Academy
  • Investing
    • Planning Your Investments Setting investment goals
    • 8 Steps to Financial Freedom
    • How to Get Out of Debt
    • Dollar Cost Averaging with Example Calculations
    • Which Credit Card Should I Get?
    • Can I Retire on 1 Million Dollars? Is it Enough?
    • Investment Vehicles Best way to invest your money?
    • How to Budget Your Money
    • Choosing a Finance Advisor
    • Asset Classes: Shares, property, fixed interest
    • The Magic of Compound Interest
  • Shares
    • Stock Market Investing and Share Market Tips
    • Short Selling Explained: What is Short Selling
    • How to Trade Like a Professional Trader
    • What are E Minis Futures? How do I Trade Them?
    • Diversification Learn how to diversify your portfolio
    • What Is Ethical Investing?
    • Creating a Trading Plan
    • The S&P/ASX 200 Index (XJO)
    • Choosing A Broker
    • Guard Your Portfolio With Defensive Stocks
    • How Much Do I Need To Invest In Shares
    • Investing VS Trading
    • What does ex dividend mean? How to ensure you receive your dividends
    • If I Could Only Invest In One Thing...
    • What Are Shares Dividends?
    • Dividend Imputation System & Franking Credits Explained Calculations
    • What is the 'Market'?
    • What Shares Should I Buy?
    • How to Buy Shares, placing an order
    • Building a Investment Portfolio Strategy
    • Trading the ASX 200 Index: ETFs, CFDs, Futures and Options
    • Creating a Trading System
    • Understanding the Share Language & Jargon of the Share Market
    • What are Income Stocks? Best Income Stocks for 2010
    • How To Pick Growth Stocks?
    • Wesfarmers (WES) vs Woolworths (WOW)
    • David Jones (DJS) VS Myer (MYR)
    • Benefits of Investing in Shares
    • How to Make Money In Shares
    • How to Treat Trading Like a Business
    • BHP vs RIO
    • Making Money In a Bear Market
    • Investing in Cloud Computing Stocks
    • High Dividend Stocks
    • Make Money Trading the Share Market
    • ANZ vs CBA vs NAB vs WBC
  • Funds
    • Managed Funds Choosing the best fund for you
    • S&P/ASX 200 ETFs: STW, IOZ, VAS
    • Managed Funds or Direct Shares
    • ETFs (Exchange Traded Funds)
    • Introduction to Index Funds
    • ETF Trading
  • Fundamental Analysis
    • Fundamental Analysis of Stocks: Qualitative Factors of the Company
    • Fundamental Analysis of Stocks: Qualitative Factors of the Industry
    • Fundamental Analysis: Quantitative Factors, Book and Price to Book Ratio
    • Fundamental Analysis: Quantitative Factors, Earnings Per Share (EPS)
    • Fundamental Analysis: Quantitative Factors, Price to Earning (P/E) and PEG
    • Fundamental Analysis: Quantitative Factors, Short Interest
    • Warren Buffett: A genius investor, a philanthropist, and a role model for citizens
    • Benjamin Graham: Father of value investing
    • Phillip Fisher
    • Peter Lynch
  • Technical Analysis
    • Charting
      • Technical Analysis: Charting: Line Chart
      • Technical Analysis: Charting: Bar Chart
      • Technical Analysis: How to Read a Candlestick Chart
      • Technical Analysis: How to Read Point and Figure Charts
      • Technical Analysis: How to Draw Trend Lines On A Stock Chart
      • Technical Analysis: What are Stock Gaps & How to Trade Them
      • Technical Analysis: How to Read & Trade Chart Patterns
    • Technical Analysis: The Secret of Moving Averages Explained
    • Learn How To Trade Support and Resistance Levels
    • Technical Analysis Indicators: Leading versus Lagging Indicators
    • Trend Following Indicators Part 1: What Is a Trend?
    • Trend Following Indicators Part 2: Trading The Average Directional Index (ADX)
    • Trend Following Indicators Part 3: The Directional Movement Index (DMI)
    • MACD Indicator Explained
    • Technical Analysis Momentum Indicators: ROC, Stochastic & RSI
    • The Relative Strength Index RSI Indicator Explained
    • Stochastic Indicator Explained
    • Momentum Following Indicators: The TRIX Indicator
    • Volume Following Indicators In Technical Analysis
    • Volume Indicators: On Balanced Volume (OBV) Indicator
    • Volume Indicators: Money Flow Index (MFI) Indicator Explained
    • Volume Following Indicators: Percentage Volume Oscillator (PVO) Indicator
    • Technical Analysis: Parabolic Stop and Reversal (PSAR) Indicator
    • Technical Analysis: Stop Loss & Trailing Stop Loss Orders
  • Commodities
    • Should I Invest in Gold? Pros and Cons of Precious Metal Investing
    • Should I Buy Gold Now?
    • Investing In Silver 7 Methods to Gain Exposure to Silver
  • Day Trading
    • Common Day Trading Myths and Lies Debunked
    • Day Trading Rules Part 1: Setup Long
    • Day Trading Rules Part 2: Setup Short
    • Buying and Selling With the Trend
    • Day Trading: The Art of Controlling Your Emotions Part 1
    • Day Trading: The Art of Controlling Your Emotions Part 2
    • Intermediate Setups and Creating a Bias Part 1
    • Intermediate Setups and Creating a Bias Part 2
    • The Art of Channel Trading
    • Day Trading Example: Walking Through a Trade – Part 1
    • Day Trading Example: Walking Through a Trade – Part 2
    • Can I Make Money Day Trading? How to Become a Day Trader?
    • Tracking the Market and Day Trading Your Stock
    • High Frequency Trading
    • What is a Trading Robot? Should I Use One to Trade?
  • Forex
    • How to Trade FOREX – Beginners Guide
    • Trading Forex
  • Derivatives
    • Options
      • Options Trading: Call Options Explained
      • Options Trading: Put Options Explained
      • Options Trading: Why Trade Options?
      • Components of an Option
      • Understanding Option Pricing Fundamentals
      • Options Trading Examples
      • Options Trading Strategies
      • Options Trading Risks
      • The Covered Call Strategy
      • Trading Options Seminars: What You Will Learn in a Teaser Seminar
    • CFDs
      • What are CFD's? Why Trade them?
      • CFD Types: Direct Market Access (DMA) VS Market Maker (MM) The Pros & Cons
      • CFD Margin Requirements Initial and Variation Margin.
      • CFD Trading: Calculating Overnight Interest Payments (Financing fees) with example
      • CFD Trading: CFD real life examples with calculations (Long & short)
      • The Pros & Cons of Trading CFDs
      • CFD Trading Risks: Learn the risks associated with trading CFDs
      • How to Choose the Best CFD Provider for You
      • CFD Trading Top 5 Trading Mistakes
      • CFD Tax Treatment
      • Learn How To Trade CFDs: Developing a system that should make us money
      • CFD Trading Example Flight Centre (FLT)

Technical Analysis: The Secret of Moving Averages Explained

  1. Articles
  2. Technical Analysis
  3. Moving Averages
11 February 2011
ยท
5 min read

What could possibly be secret about the well know and simple tool of moving averages? Surprisingly, many do not appreciate how much a moving average can tell you about trend, and even more will ignore the powerful buy and sell signals generated. For those interested in taking their trading to the next level….read on.

Moving Averages and the Long Range Trend

Sound investment will usually start with the very big picture and narrow it down to a precise trading window. The big picture should include what the overall market is doing, and a careful examination of a multi-year trend with a particular stock. You should never trade against the current market sentiment or the long term trend of a stock. What is market sentiment? That will be discussed in another article. How do we determine the long-term trend with moving averages? We will answer that right now.

Two key averages to memorize are:

  • 350 day moving average
  • 200 day moving average

The 350 and 200 Day Moving Averages

The first goal is to see if the particular stock seems to have a correlation to a long term trendline or moving average. Put the stock on a chart with both averages (simple moving averages). Does the price seem to bounce off a certain moving average? Some stocks will have no relevance with these long term moving averages but the majority will.

6.5 year chart of ASX 200 with 200 and 350 day simple moving averages
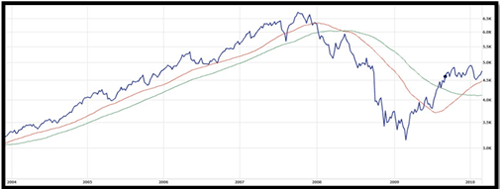
6.5 year chart of ASX 200 with 200 and 350 day simple moving averages

If either the 200 or the 350 day moving average seems to have some interaction with prices, then use exclusively that one. With the ASX 200 in the above chart, the red line seems to have more relevance which is the 200 day moving average.

Quick tip for 200 and 350 day moving averages

Try the settings on both simple and exponential moving averages for the best fit with price data

On the chart below the 350 day moving average has been removed since it had little correlation to the price of the stock. Furthermore, I drew green circles when the price was above the 200 day moving average and red circles when the price was below the 200 day moving average. This allows the trader to quickly see the long term trends and which one they are in right now.

ASX 200 with 200 day moving average
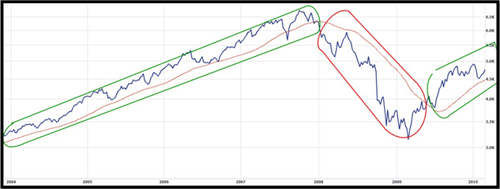
ASX 200 with 200 day moving average

According to this chart, the ASX 200 is in a current bull trend. As well, the prices have recently bounced off the average. This means we should only invest long at this point in time.

REMEMBER: prices above the long term moving average mean a bull trend; prices below mean a bearish trend.

The 50 Day Moving Average

Now that we know the long term trend of the stock, we would like to zero in on another important aspect: institutional support.

The big players in the market with the most clout are often the most predictable. Managers of multi-million dollar funds are not able to buy and sell as easily as a trader with 10 or 20 thousand dollars. As such, they will often use predictable techniques to slowly buy and sell.

One technique they have used for a very long time is the buying and selling at the 50 day moving average. If you notice a certain stock seems to bounce along the 50 day moving average, you might reasonably conclude that institutions are interested in this stock. Institutions are a welcome sight in stocks IF they are accumulating. If the tables turn and the stock drops below this value, the large players might start to liquidate which could have disastrous effects.

The key is:

  • Look for a correlation between prices and the 50 day moving average
  • If there is, consider timing purchases after bounces and sell when price makes serious break below the 50 day moving average.

BHP Billiton Limited (BHP) with 50 day moving average

BHP Billiton Limited (BHP) with 50 day moving average

BHP has a very tight relationship with the 50 day moving average (the red line). I have highlighted in green the bounces off the 50 day moving average. The red circles show punctures of the 50 day moving average where caution is warranted.

A very simple trading system could be used with this chart. Buy on each bounce or even when price pops above the 50 day moving average and sell after 5 – 10% gain. This is important for even long term buy and hold investors to know if institutions are holding prices up or pushing them down. As of the beginning of March, the price is still being held under water by the 50 day moving average.

Knowing the sentiment of institutional investors will give you a strong edge.

The Short Term Moving Average Trigger

The final moving average we will discuss is for short term triggers to be used with other indicators only. The particular moving average we will use is the 10 day, although some traders will use the 20 day. I have found the shorter term one more proficient.

How do we use the 10 day moving average? One method is as a stop loss. Imagine our trading system gets us into a short term trade, perhaps with highly leveraged CFD’s or options. Using the 10 day moving average will get us out the trade. Particularly is this useful for momentum buying.

Amcor Limited (AMC) with 10 day moving average and RSI indicator
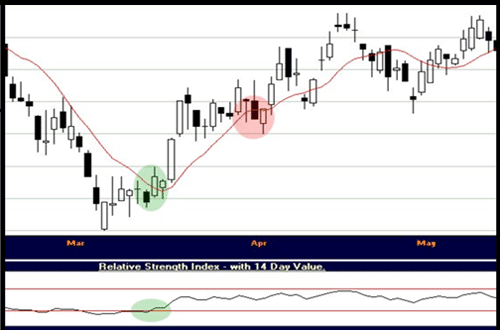
Amcor Limited (AMC) with 10 day moving average and RSI indicator

We will use the 10 day moving average as our trigger to buy and sell. If the RSI gives a buy signal (see RSI article), we wait until prices move above the 10 day moving average.

Once prices fall below the 10 day moving average we sell with our short term trade.

With this stock we bought around 4 dollars and sold at 4.50 for a 12.5 percent profit.

Trading the 10 day moving average can be incorporated into almost any system. If your technical indicators say buy but the prices are below the 10 day moving average, wait until it rises above as confirmation. If the technical indicators say sell, you are welcome to wait until the 10 day moving average is pierced. Often, the 10 day moving average will indicate buy and sell orders before the other indicators.

Moving Averages are Powerful

Understanding long term to short range moving averages are powerful aids to healthy trading. In fact, moving averages are the basis for many other technical indicators. Remember the three basic ways we use them: to determine long term trend, to see if institutions are actively trading the stock, and a short term trigger for buying and selling. Follow these three simple rules and profitable trading will be yours.

technical analysis
You May Also Like
  • MACD Indicator Explained
  • The Relative Strength Index RSI Indicator Explained
  • Learn How To Trade CFDs: Developing a system that should make us money
  • Technical Analysis: Parabolic Stop and Reversal (PSAR) Indicator
  • Momentum Following Indicators: The TRIX Indicator
About Privacy Contact v2.0.1
© 2025 The Domain Publisher Pty Ltd.
This website uses cookies to ensure you get the best experience on our website. Learn more about cookies