Academy
  • Log in
  • Sign up
  • StockWatch
  • Lobby
  • Academy
  • Investing
    • Planning Your Investments Setting investment goals
    • 8 Steps to Financial Freedom
    • How to Get Out of Debt
    • Dollar Cost Averaging with Example Calculations
    • Which Credit Card Should I Get?
    • Can I Retire on 1 Million Dollars? Is it Enough?
    • Investment Vehicles Best way to invest your money?
    • How to Budget Your Money
    • Choosing a Finance Advisor
    • Asset Classes: Shares, property, fixed interest
    • The Magic of Compound Interest
  • Shares
    • Stock Market Investing and Share Market Tips
    • Short Selling Explained: What is Short Selling
    • How to Trade Like a Professional Trader
    • What are E Minis Futures? How do I Trade Them?
    • Diversification Learn how to diversify your portfolio
    • What Is Ethical Investing?
    • Creating a Trading Plan
    • The S&P/ASX 200 Index (XJO)
    • Choosing A Broker
    • Guard Your Portfolio With Defensive Stocks
    • How Much Do I Need To Invest In Shares
    • Investing VS Trading
    • What does ex dividend mean? How to ensure you receive your dividends
    • If I Could Only Invest In One Thing...
    • What Are Shares Dividends?
    • Dividend Imputation System & Franking Credits Explained Calculations
    • What is the 'Market'?
    • What Shares Should I Buy?
    • How to Buy Shares, placing an order
    • Building a Investment Portfolio Strategy
    • Trading the ASX 200 Index: ETFs, CFDs, Futures and Options
    • Creating a Trading System
    • Understanding the Share Language & Jargon of the Share Market
    • What are Income Stocks? Best Income Stocks for 2010
    • How To Pick Growth Stocks?
    • Wesfarmers (WES) vs Woolworths (WOW)
    • David Jones (DJS) VS Myer (MYR)
    • Benefits of Investing in Shares
    • How to Make Money In Shares
    • How to Treat Trading Like a Business
    • BHP vs RIO
    • Making Money In a Bear Market
    • Investing in Cloud Computing Stocks
    • High Dividend Stocks
    • Make Money Trading the Share Market
    • ANZ vs CBA vs NAB vs WBC
  • Funds
    • Managed Funds Choosing the best fund for you
    • S&P/ASX 200 ETFs: STW, IOZ, VAS
    • Managed Funds or Direct Shares
    • ETFs (Exchange Traded Funds)
    • Introduction to Index Funds
    • ETF Trading
  • Fundamental Analysis
    • Fundamental Analysis of Stocks: Qualitative Factors of the Company
    • Fundamental Analysis of Stocks: Qualitative Factors of the Industry
    • Fundamental Analysis: Quantitative Factors, Book and Price to Book Ratio
    • Fundamental Analysis: Quantitative Factors, Earnings Per Share (EPS)
    • Fundamental Analysis: Quantitative Factors, Price to Earning (P/E) and PEG
    • Fundamental Analysis: Quantitative Factors, Short Interest
    • Warren Buffett: A genius investor, a philanthropist, and a role model for citizens
    • Benjamin Graham: Father of value investing
    • Phillip Fisher
    • Peter Lynch
  • Technical Analysis
    • Charting
      • Technical Analysis: Charting: Line Chart
      • Technical Analysis: Charting: Bar Chart
      • Technical Analysis: How to Read a Candlestick Chart
      • Technical Analysis: How to Read Point and Figure Charts
      • Technical Analysis: How to Draw Trend Lines On A Stock Chart
      • Technical Analysis: What are Stock Gaps & How to Trade Them
      • Technical Analysis: How to Read & Trade Chart Patterns
    • Technical Analysis: The Secret of Moving Averages Explained
    • Learn How To Trade Support and Resistance Levels
    • Technical Analysis Indicators: Leading versus Lagging Indicators
    • Trend Following Indicators Part 1: What Is a Trend?
    • Trend Following Indicators Part 2: Trading The Average Directional Index (ADX)
    • Trend Following Indicators Part 3: The Directional Movement Index (DMI)
    • MACD Indicator Explained
    • Technical Analysis Momentum Indicators: ROC, Stochastic & RSI
    • The Relative Strength Index RSI Indicator Explained
    • Stochastic Indicator Explained
    • Momentum Following Indicators: The TRIX Indicator
    • Volume Following Indicators In Technical Analysis
    • Volume Indicators: On Balanced Volume (OBV) Indicator
    • Volume Indicators: Money Flow Index (MFI) Indicator Explained
    • Volume Following Indicators: Percentage Volume Oscillator (PVO) Indicator
    • Technical Analysis: Parabolic Stop and Reversal (PSAR) Indicator
    • Technical Analysis: Stop Loss & Trailing Stop Loss Orders
  • Commodities
    • Should I Invest in Gold? Pros and Cons of Precious Metal Investing
    • Should I Buy Gold Now?
    • Investing In Silver 7 Methods to Gain Exposure to Silver
  • Day Trading
    • Common Day Trading Myths and Lies Debunked
    • Day Trading Rules Part 1: Setup Long
    • Day Trading Rules Part 2: Setup Short
    • Buying and Selling With the Trend
    • Day Trading: The Art of Controlling Your Emotions Part 1
    • Day Trading: The Art of Controlling Your Emotions Part 2
    • Intermediate Setups and Creating a Bias Part 1
    • Intermediate Setups and Creating a Bias Part 2
    • The Art of Channel Trading
    • Day Trading Example: Walking Through a Trade – Part 1
    • Day Trading Example: Walking Through a Trade – Part 2
    • Can I Make Money Day Trading? How to Become a Day Trader?
    • Tracking the Market and Day Trading Your Stock
    • High Frequency Trading
    • What is a Trading Robot? Should I Use One to Trade?
  • Forex
    • How to Trade FOREX – Beginners Guide
    • Trading Forex
  • Derivatives
    • Options
      • Options Trading: Call Options Explained
      • Options Trading: Put Options Explained
      • Options Trading: Why Trade Options?
      • Components of an Option
      • Understanding Option Pricing Fundamentals
      • Options Trading Examples
      • Options Trading Strategies
      • Options Trading Risks
      • The Covered Call Strategy
      • Trading Options Seminars: What You Will Learn in a Teaser Seminar
    • CFDs
      • What are CFD's? Why Trade them?
      • CFD Types: Direct Market Access (DMA) VS Market Maker (MM) The Pros & Cons
      • CFD Margin Requirements Initial and Variation Margin.
      • CFD Trading: Calculating Overnight Interest Payments (Financing fees) with example
      • CFD Trading: CFD real life examples with calculations (Long & short)
      • The Pros & Cons of Trading CFDs
      • CFD Trading Risks: Learn the risks associated with trading CFDs
      • How to Choose the Best CFD Provider for You
      • CFD Trading Top 5 Trading Mistakes
      • CFD Tax Treatment
      • Learn How To Trade CFDs: Developing a system that should make us money
      • CFD Trading Example Flight Centre (FLT)

Trend Following Indicators - Part 3: The Directional Movement Index (DMI)

  1. Articles
  2. Technical Analysis
  3. DMI Indicator
13 February 2011
ยท
4 min read

Series 3 articles

  • Trend Following Indicators - Part 1: What Is a Trend?
  • Trend Following Indicators - Part 2: Trading The Average Directional Index (ADX)
  • Trend Following Indicators - Part 3: The Directional Movement Index (DMI)

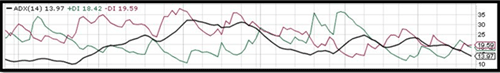
Often associated with the Average Directional Index are two colored lines. Often in the hue red and green, these are called the plus (+) and minus (–) Directional Movement Index lines. Actually, the ADX is a derivative of the +/- DI’s.

The Average Directional Index with two colored lines.

As we learned in a previous lesson, we trade the trend when the ADX (black) line stays below the 20 for at least one month, and then rises above it. When the ADX line turns downward, the trend is weakening.

Interpreting the +/- Directional Movement Indexes

The + DI is represented in this indicator box by a green line. The – DI is depicted by a red line. The default setting we will use is 14 periods. On our daily charts this means the previous 14 days are used as a data source.

As the stock rises, the +DI (green line) goes up. If the stock falls, the –DI (red line) goes up. The DI line that is on top is referred to as the dominant DI.

  • If the red is on top, you can assume a downtrend.
  • If the green is on top, you can assume an uptrend.

Creating Entry Signals with the Directional Movement Index

Perhaps the most common way to trade the DMI, is to enter a trade at the crossover point. When the red crosses above the green, go short. If the green crosses above the red, go long.

The following diagram uses blue and red for the + and – DI’s.

WPL with DMI Indicator Box

WPL with DMI Indicator Box

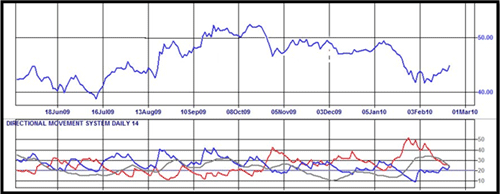
Notice the amount of times the + and the – cross above each other. If a trader were to buy long and sell short each time the DI’s crossed over each other, there would be a severe whipsaw effect. A whipsaw is where a signal is generated and shortly thereafter reversed causing the analyst to overtrade and lose.

How can we create better entry signals with the ADX and the DMI?

Confirming the Signals with the ADX

A couple of methods exist that can be used to increase the reliability of the DMI. The first is simple: use it in conjunction with the ADX. Recall that we only want to buy at the beginning of a trend when the darker colored ADX rises above the 20. This can be further modified by saying as long as the +/- DI’s crossover above the ADX, it is valid. If the crossover occurs below the ADX, the trend is already too far along to trade with confidence.

By analyzing Cougar Metals (CGM) we can see the two types of entry signals, one valid and the other not.

CGM with ADX and DMI indicators

CGM with ADX and DMI indicators

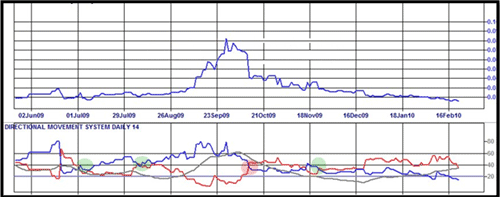
The green circles show where a +/- DI crossover occurs above the ADX line. This can be considered a valid signal. Even better is when the crossover occurs when the ADX is rising above the 20 reference line.

The red circle shows where a sell short signal is generated when the negative DI crosses above the positive. Because the ADX line is above the crossover, the trend is already strongly in play. Jumping aboard this trend would be too risky for the potential gain.

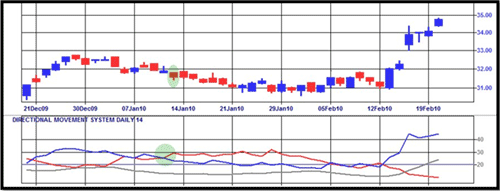
Confirming the Signals with Candlesticks

There is another method to confirm the validity of the signals with the +/- DI’s. To see how this works, we will need to use candlestick and a much more detailed chart. The chart we will look at is ASX Limited. The green box highlights the trading window and bullish indicator we will consider.

ASX Limited with ADX and DMI indicators

ASX Limited with ADX and DMI indicators

We will zoom in further yet again (in yellow box).

The exact day of the bullish crossover is analyzed. This day of price action is colored green. The first thing we do when a crossover occurs is to take note of the daily extremes.

If it is a bullish crossover, we record the daily high. To enter the trade, the following days prices must be higher than the daily high we recorded on crossover day.

In this example, the price went as high as 35 dollars on crossover day. The next day the prices fell so we do not buy. We wait until the prices do break above our 35 dollar trading confirmation. Or we have the option of backing out of this trade if we feel it failed.

Four days later the price did rise above the daily highs of the crossover day. That would be our first valid entry point.

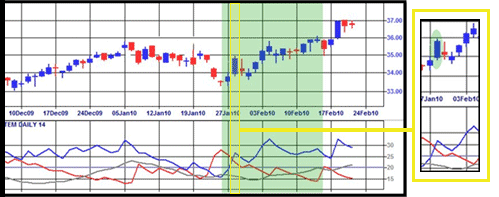
We will now consider candlestick confirmation when the - DI crosses above the +DI, or we are assuming a new downtrend. The stock is CSL.AX. The green circle shows the DI crossover as well as the candlestick we are about to analyze.

CSL with ADX and DMI

CSL with ADX and DMI

To make this process easier, we merely extend a horizontal line from the lowest point on the crossover day. The price must go lower than this price for our potential downtrend to be valid. If you look carefully at the chart below you can see a thin green horizontal line protruding from the bottom of the candlestick.

CSL with ADX and DMI

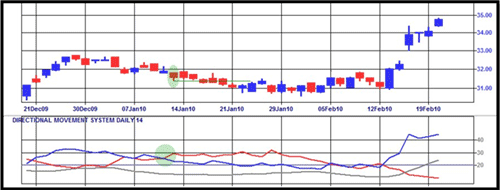
When the prices fall below this point our downtrend is considered valid. But as we look at this chart, the downtrend proves to be quite weak. Even with good technical analysis we still need to be careful and have a razor sharp exit strategy in case of a failed trade.

Looking a little further down the chart around February 13th 2010, we see where the bullish crossover signal that is both above the ADX line and has candlestick confirmation becomes quite profitable.

Trend Trading Rules with +/- DI

  • Trade crossovers
  • Make sure crossover occurs above ADX line
  • Confirm with candlesticks by noting daily price extremes on crossover day
    • If bullish crossover, succeeding days must go above the crossover daily high for a valid entry signal
    • If a bearish crossover, succeeding days must go below the crossover daily low for a valid entry signal
Series: Previous
technical analysis
You May Also Like
  • MACD Indicator Explained
  • Learn How To Trade CFDs: Developing a system that should make us money
  • Momentum Following Indicators: The TRIX Indicator
  • Volume Indicators: On Balanced Volume (OBV) Indicator
About Privacy Contact v2.0.1
© 2025 The Domain Publisher Pty Ltd.
This website uses cookies to ensure you get the best experience on our website. Learn more about cookies