Academy
  • Log in
  • Sign up
  • StockWatch
  • Lobby
  • Academy
  • Investing
    • Planning Your Investments Setting investment goals
    • 8 Steps to Financial Freedom
    • How to Get Out of Debt
    • Dollar Cost Averaging with Example Calculations
    • Which Credit Card Should I Get?
    • Can I Retire on 1 Million Dollars? Is it Enough?
    • Investment Vehicles Best way to invest your money?
    • How to Budget Your Money
    • Choosing a Finance Advisor
    • Asset Classes: Shares, property, fixed interest
    • The Magic of Compound Interest
  • Shares
    • Stock Market Investing and Share Market Tips
    • Short Selling Explained: What is Short Selling
    • How to Trade Like a Professional Trader
    • What are E Minis Futures? How do I Trade Them?
    • Diversification Learn how to diversify your portfolio
    • What Is Ethical Investing?
    • Creating a Trading Plan
    • The S&P/ASX 200 Index (XJO)
    • Choosing A Broker
    • Guard Your Portfolio With Defensive Stocks
    • How Much Do I Need To Invest In Shares
    • Investing VS Trading
    • What does ex dividend mean? How to ensure you receive your dividends
    • If I Could Only Invest In One Thing...
    • What Are Shares Dividends?
    • Dividend Imputation System & Franking Credits Explained Calculations
    • What is the 'Market'?
    • What Shares Should I Buy?
    • How to Buy Shares, placing an order
    • Building a Investment Portfolio Strategy
    • Trading the ASX 200 Index: ETFs, CFDs, Futures and Options
    • Creating a Trading System
    • Understanding the Share Language & Jargon of the Share Market
    • What are Income Stocks? Best Income Stocks for 2010
    • How To Pick Growth Stocks?
    • Wesfarmers (WES) vs Woolworths (WOW)
    • David Jones (DJS) VS Myer (MYR)
    • Benefits of Investing in Shares
    • How to Make Money In Shares
    • How to Treat Trading Like a Business
    • BHP vs RIO
    • Making Money In a Bear Market
    • Investing in Cloud Computing Stocks
    • High Dividend Stocks
    • Make Money Trading the Share Market
    • ANZ vs CBA vs NAB vs WBC
  • Funds
    • Managed Funds Choosing the best fund for you
    • S&P/ASX 200 ETFs: STW, IOZ, VAS
    • Managed Funds or Direct Shares
    • ETFs (Exchange Traded Funds)
    • Introduction to Index Funds
    • ETF Trading
  • Fundamental Analysis
    • Fundamental Analysis of Stocks: Qualitative Factors of the Company
    • Fundamental Analysis of Stocks: Qualitative Factors of the Industry
    • Fundamental Analysis: Quantitative Factors, Book and Price to Book Ratio
    • Fundamental Analysis: Quantitative Factors, Earnings Per Share (EPS)
    • Fundamental Analysis: Quantitative Factors, Price to Earning (P/E) and PEG
    • Fundamental Analysis: Quantitative Factors, Short Interest
    • Warren Buffett: A genius investor, a philanthropist, and a role model for citizens
    • Benjamin Graham: Father of value investing
    • Phillip Fisher
    • Peter Lynch
  • Technical Analysis
    • Charting
      • Technical Analysis: Charting: Line Chart
      • Technical Analysis: Charting: Bar Chart
      • Technical Analysis: How to Read a Candlestick Chart
      • Technical Analysis: How to Read Point and Figure Charts
      • Technical Analysis: How to Draw Trend Lines On A Stock Chart
      • Technical Analysis: What are Stock Gaps & How to Trade Them
      • Technical Analysis: How to Read & Trade Chart Patterns
    • Technical Analysis: The Secret of Moving Averages Explained
    • Learn How To Trade Support and Resistance Levels
    • Technical Analysis Indicators: Leading versus Lagging Indicators
    • Trend Following Indicators Part 1: What Is a Trend?
    • Trend Following Indicators Part 2: Trading The Average Directional Index (ADX)
    • Trend Following Indicators Part 3: The Directional Movement Index (DMI)
    • MACD Indicator Explained
    • Technical Analysis Momentum Indicators: ROC, Stochastic & RSI
    • The Relative Strength Index RSI Indicator Explained
    • Stochastic Indicator Explained
    • Momentum Following Indicators: The TRIX Indicator
    • Volume Following Indicators In Technical Analysis
    • Volume Indicators: On Balanced Volume (OBV) Indicator
    • Volume Indicators: Money Flow Index (MFI) Indicator Explained
    • Volume Following Indicators: Percentage Volume Oscillator (PVO) Indicator
    • Technical Analysis: Parabolic Stop and Reversal (PSAR) Indicator
    • Technical Analysis: Stop Loss & Trailing Stop Loss Orders
  • Commodities
    • Should I Invest in Gold? Pros and Cons of Precious Metal Investing
    • Should I Buy Gold Now?
    • Investing In Silver 7 Methods to Gain Exposure to Silver
  • Day Trading
    • Common Day Trading Myths and Lies Debunked
    • Day Trading Rules Part 1: Setup Long
    • Day Trading Rules Part 2: Setup Short
    • Buying and Selling With the Trend
    • Day Trading: The Art of Controlling Your Emotions Part 1
    • Day Trading: The Art of Controlling Your Emotions Part 2
    • Intermediate Setups and Creating a Bias Part 1
    • Intermediate Setups and Creating a Bias Part 2
    • The Art of Channel Trading
    • Day Trading Example: Walking Through a Trade – Part 1
    • Day Trading Example: Walking Through a Trade – Part 2
    • Can I Make Money Day Trading? How to Become a Day Trader?
    • Tracking the Market and Day Trading Your Stock
    • High Frequency Trading
    • What is a Trading Robot? Should I Use One to Trade?
  • Forex
    • How to Trade FOREX – Beginners Guide
    • Trading Forex
  • Derivatives
    • Options
      • Options Trading: Call Options Explained
      • Options Trading: Put Options Explained
      • Options Trading: Why Trade Options?
      • Components of an Option
      • Understanding Option Pricing Fundamentals
      • Options Trading Examples
      • Options Trading Strategies
      • Options Trading Risks
      • The Covered Call Strategy
      • Trading Options Seminars: What You Will Learn in a Teaser Seminar
    • CFDs
      • What are CFD's? Why Trade them?
      • CFD Types: Direct Market Access (DMA) VS Market Maker (MM) The Pros & Cons
      • CFD Margin Requirements Initial and Variation Margin.
      • CFD Trading: Calculating Overnight Interest Payments (Financing fees) with example
      • CFD Trading: CFD real life examples with calculations (Long & short)
      • The Pros & Cons of Trading CFDs
      • CFD Trading Risks: Learn the risks associated with trading CFDs
      • How to Choose the Best CFD Provider for You
      • CFD Trading Top 5 Trading Mistakes
      • CFD Tax Treatment
      • Learn How To Trade CFDs: Developing a system that should make us money
      • CFD Trading Example Flight Centre (FLT)

Technical Analysis: What are Stock Gaps & How to Trade Them

  1. Articles
  2. Technical Analysis
  3. Charting
  4. Gap Analysis
24 February 2011
·
4 min read

Series 5 articles

  • Technical Analysis: Charting: Line Chart
  • Technical Analysis: Charting: Bar Chart
  • Technical Analysis: How to Read a Candlestick Chart
  • Technical Analysis: How to Draw Trend Lines On A Stock Chart
  • Technical Analysis: What are Stock Gaps & How to Trade Them

One of the advantages of using bar charts or candlestick charts is the ability to see when prices jump higher or lower while missing an entire trading range. A line chart will merely show a continuous trading line that is misleading.

NCM during 2009 – line chart
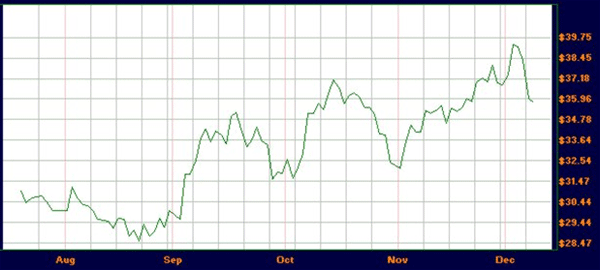
NCM during 2009 – line chart

Were we to examine this identical chart with candlesticks we would notice an interesting pattern.

NCM during 2009 – candlestick chart
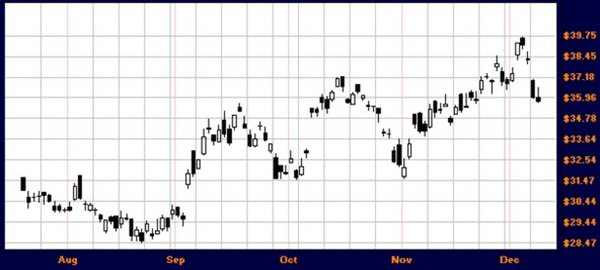
NCM during 2009 – candlestick chart

Within this chart is a couple of noticeable spots where the price jumped or fell while gapping across certain price ranges.

  • September 2nd prices closed at $29.58. The next morning they gapped up to $31.30 missing most of the $29 - $31 range.
  • October 6th the prices closed at $32.93. The next morning the price jumped to $35.37.
  • December 4th NCM closed at $38.30. The next trading day it opened at $37.00 and continued to fall without once trading in the $37 range.

Gap-ups and Gap-downs

When prices jump right up through a trading range this is called a gap-up. This will often occur when positive news is released while the market is closed, or when a major event occurs such as earnings reports and has an unexpected upside surprise.

Gap-downs occur when prices jump downward and skip a price range. As well, negative news after the market closes or negative EPS surprises can be the cause of such an effect.

The Major Types of Gaps

Gaps are usually categorized in four major classes: common, exhaustion, breakaway, and runaway.

It is important to know which type of gap fits the data since the trading may continue in the direction of the large move, it may reverse direction, or the price may retreat and then resume its normal direction.

The Common Gap

Also termed area gaps or trading gaps, these leaps in price movement are common and uneventful. The market psychology will change somewhat between market closing and opening the next trading day. When the market opens significantly different the next morning with little apparent reason, and it does not fit the mentality of the other gap types, it will likely be a common gap.

Common gaps are usually filled in quite quickly. Filling in means the price reverses the direction of the gap, if only temporarily, and then resumes trading. Often, the gaps are filled the same day.

September 3rd, NCM closed at $31.85. The morning of September 4th had the price opening at $33.04. The price jumped almost four percent overnight. But the price slid during the day and closed three cents lower than the September 3rd.

NCM Common Gap-up
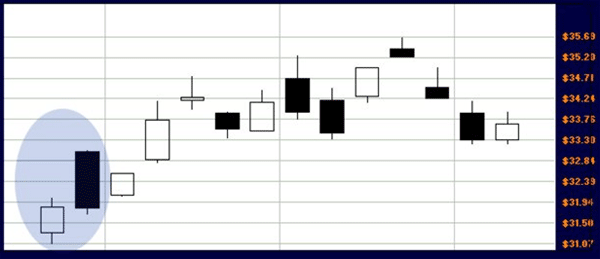
NCM Common Gap-up

The Exhaustion Gap

After prices have been either trending up or down for a while, the sentiment may be nearing exhaustion.

Imagine a stock trading downwards for a long period of time despite company restructuring and improvement of the bottom line. After a long while, the last of the weak hands finally give up and sell off the remainder of their stock in despair. It is quickly bought up by bargain hunters or technical analysts, the price may find solid ground and can reverse the trend.

Conversely, perhaps the stock has been climbing for some time in an upwards trend. As euphoria reaches an all time high, the price gaps up. The last of the buyers come out of the woodwork thinking this is a sure bet as the current stock holders dump their shares in great quantity. After this initial transfer and no new buyers, the price reverses direction.

Look for these two requirements when trying to decide if the gap is an exhaustion gap.

  • Extremely high volume (perhaps 2x the normal)
  • After a long-time trend has been in place

Examining NCM at an earlier date, we will examine the blue area that shows a reversal from a downtrend to an uptrend.

NCM Exhaustion Gap
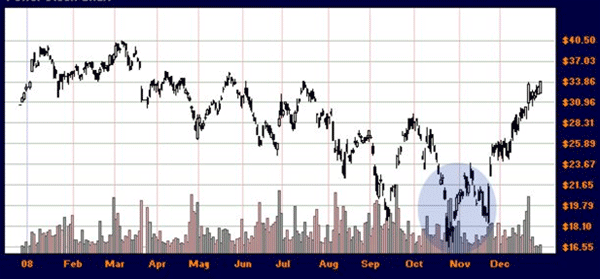
NCM Exhaustion Gap

Next we will zoom in to look at the price gap and volume a little more closely.

NCM Exhaustion Gap
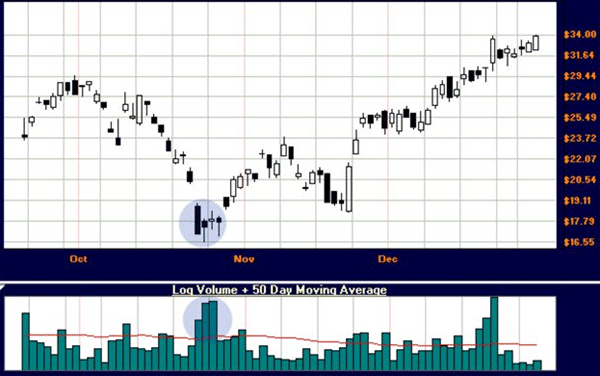
NCM Exhaustion Gap

Note the two blue circles. One shows the gap on the char, the other shows the volume spike during those trades. Because this occurs at the end of a very long down-trend, we can assume the price will fill and reverse…which it does.

Breakaway Gaps

This type of gap is considered a breakout. Prices will usually go through stages of trending, then consolidation, and back to trending again. Sometimes, after a consolidation pattern, or after toying with a support and resistance, prices will breakaway.

  • Prices break upwards or downward through support or resistance
  • Volume increases
  • The trend usually continues

Notice on the stock ALL how the price consolidates. When the price finally jumps down to break resistance, the volume also increases.

ALL Breakaway Gap
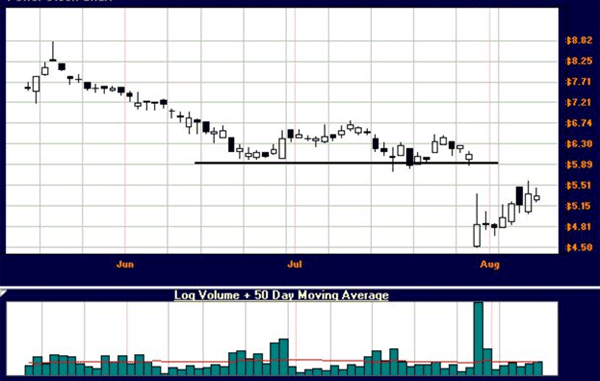
ALL Breakaway Gap

Runaway or Continuation Gaps

The final class of gap is one that occurs in the middle of a trend.

Perhaps the stock is moving up at a measured pace. Suddenly there is an increase of interest in the stock and the price gaps up and continues to trade in the former trend.

Or the stock may be declining over time and there is an increased bearish sentiment in the stock and the price gaps downward and continues to trade lower.

CPU Continuation Gap
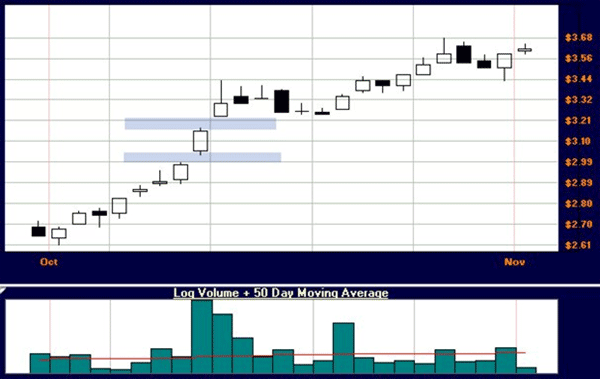
CPU Continuation Gap

As can be seen in CPU.AX, the trend is in the middle of its movement when a couple of minor gaps occur with decent volume as the trend continues.

Should You Play the Gap?

There are numerous ways to play gaps. Some will day-trade them, others will use them as signals needing confirmation for a reversal, fade the gap, and so on. Still others will shy away from them altogether since such a drastic change in price can have large repercussions if the investor plays the gap wrong.

If you are interested in profiting from gaps, you will first need to get very proficient at telling one from another. Make sure you examine support and resistance levels, if the gap is at the middle of a trend or at the late stages of it, and if volume is a supporting factor.

Series: Previous
technical analysis charting
You May Also Like
  • Day Trading Example: Walking Through a Trade – Part 1
  • Learn How To Trade Support and Resistance Levels
  • Buying and Selling With the Trend
  • Learn How To Trade CFDs: Developing a system that should make us money
About Privacy Contact v2.0.1
© 2025 The Domain Publisher Pty Ltd.
This website uses cookies to ensure you get the best experience on our website. Learn more about cookies