From choosing a broker to selling shares for profit, this is your quick guide to trading like a professional.
1. Accounts and Brokers
Before you even begin to think about analysing the complexities of the market and strategising for profit, you need to consider the nuts and bolts of how you will trade. One option for the long-term investor with an abundance of money and who is short on time is a full service brokerage.
A full service brokerage can provide you with a range of services which are run by professionals. If you are too busy to keep up with rules on how franking credits affect taxes, which company just got upgraded, and when earnings are due on your favorite gold stock, you may want to consider a full service brokerage. You can even phone your broker who will place the trade for you. There is, however, a cost associated with this. Fees will vary, but being charged in excess of 1% of the trade is not uncommon.
Discount brokerages are for those that want to perform their own research and handle their own trades. Online trading through such a brokerage will have reduced fees. If you prefer to handle your own investing finances, read on.
2. Type of Orders: Market and Limit
One of the first terminologies you will need to learn when placing an order is ‘limit’ or ‘market’.
A market order is when you offer to buy a certain amount of shares regardless of the price. You buy whatever the market price is at that moment. This is a quick way to grabbing shares. If you are buying a small position in a stock highly traded, you could get your shares for the asking price. But be forewarned that on thinly traded stocks, you could end up paying a whole lot more that you bargained for. If your purchase drives the price up resulting in a higher average cost, you have experienced slippage.
A limit order is when you place a limit on the price. If few shares are available, you will buy up to your limit, and then wait for more shareholders to offer their stock. Limit orders are a safer way to trade, even when you place your buying limit above the current asking price. Thus, you are willing to pay asking price while protecting yourself against a wild run-up. Keep an eye on changing rules here as the new market operator Chi-X may start to offer rebates on certain limit orders.
3. Stop-loss Orders
A stop loss order is simply a trigger to sell your shares. You can enter this at the time of buying. For example, you buy shares at $10 and set in a stop loss order at $9. If shares fall down to this level, your position will immediately be liquidated.
There is also a trailing stop loss. This is a dynamic or moving stop. For example, I set the trailing stop loss at 5%. If shares fall from $10 to $9.50, this 5% drop will trigger my sell order. If shares rise to $20, my stop loss order is now at $19, or 5% below the price. A trailing stop-loss order will rise with the share price, but it will never go down. It acts like a snake that slowly tightens around the share price but never loosens.
4. Market Capitalization
Do you like buying big well-known stocks generating cash or do you prefer to side with the little company that’s trying to aggressively grow from tiny to large? Some new investors feel that you can determine the size of a company by its share price. This is only half of the picture. To know how investment money is floating around you need to multiply the share price by the amount of shares.
• Share price x total shares = market capitalization
There are differing definitions as to what is small, medium, and big since different markets have a different range of company sizes and dollars invested into them. In Australia the market caps are defined:
- Small Cap Company: $1 - $250 million
- Mid Cap Company: $251 million - $1 billion
- Large Cap Company: $1 billion+
Smaller cap companies are usually more volatile than the giants. Fewer shares are traded in the smaller cap shares so placing limit orders will become more important.
5. Volume and Liquidity
Volume refers to the amount of shares being traded in a day. Of course, smaller companies will usually have lower investor interest leading to lower daily volume. The bigger the company and the more widely it is known, the more shares will exchange hands per trading day.
Liquidity is important to understand as you will need to manage large trades on very tiny stocks very differently than on big ones.
6. Settlement
For all intents and purposes, it would appear that when you hit the sell or buy button you instantly own the shares. Appearances can be deceiving. While you are guaranteed the purchase price that is recorded online, it takes up to 3 days (T + 3) for the ownership of the shares to change. This often means very little to the average investor unless he is trading for dividends.
You see, there is a record date where the dividend-paying company looks up on file who owns the shares. These investors will be paid the dividend. But to be on file for the record date, you need to have bought the shares three days previous.
7. Fundamental Analysis
Fundamental analysis is how an accountant views the company. While you need not dig into income statements, cash flows, and other balance sheets, it might be helpful to look at just a few items.
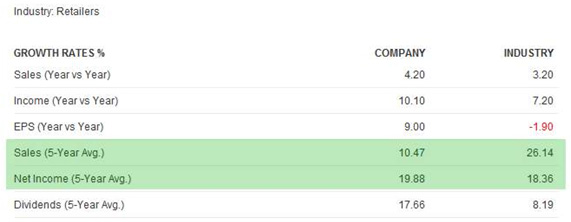
How much has the company grown annually? By looking multi-year averages on sales and earnings growth you will better understand if the company is expanding or contracting. Remember, profit is good but it should be made by an accompanied increase in sales or revenue.

How much value does the company have? Some stocks have a lot of assets and others are serviced based. An accountant will be interested in the net worth of a company and the amount of profit it brings in relative to share price. Price to book value will tell you how close the shares are trading to the net worth of a company while price to earnings will tell you the share value compared to the annual earnings.
By themselves these statistics are islands. But if you compare them to their competitors or to the average of their industry, you might get a clearer picture if the company is trading at higher valuations than their peers.

Technical Analysis
Technical analysis refers to analyzing how the stock is being traded. It gives no consideration to accounting, profits, or sales. You simply look at a price and volume chart to determine how the stock is being traded and where it might land in the future. Here are a couple basic techniques to use with technical analysis.
Support and resistance occurs when share prices hit a certain level and retreat. The longer and more frequently share prices trade at these levels, the more powerful the effect is. For example, if a stock keeps trading up to $100 but has never gone above this amount in 10 years, it becomes a powerful resistance, much like an overhead ceiling. When the stock finally does break above this level, you now have a solid footing underneath like a floor. If the stock goes down to $100, some traders will buy it up at this support. If the selling pressure is too intense and the floor cracks, watch out below.
Example of Support and Resistance Levels

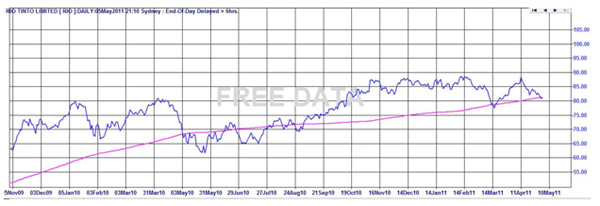
Moving averages are another staple of technical analysis. The moving average is arrived at by adding together all the prices in a certain time frame and coming up with an average. Popular moving averages are 200 days for long-term investors, 50 days for medium term investors, and 10 days for very short term aggressive investors. When share prices rise above, this is considered bullish. When prices fall below, this is bearish within the given time frame.
Example of a 200 day Moving Average

Trading Like a Professional
Last, you will need patience and discipline. Trading takes time and effort. You will make mistakes. There is a lot to learn about analysing shares. Your emotions will run wild and you will buy and sell at the wrong times. But be kind to yourself and learn from your mistakes. If you lose money on a trade, analyse why it happened and treat it as ‘on the job’ training. Professionals make mistakes all the time and how you handle such errors is what will ultimately define you as a successful investor.