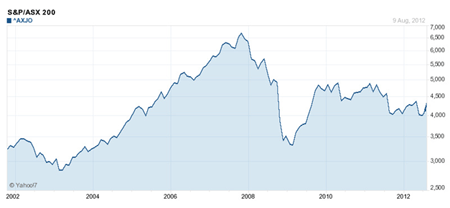
We had a great bull run from 2003 to 2008 in Australian markets that lasted 5 years. After a nasty drop that cut portfolios in half, we have been struggling to regain lost ground ever since. While we expect the markets to recover long-term, how can we play the bleaker short-term where governments are running out of credit and banks need cash injections to stay liquid? How can long-term bullish investors play this market to protect capital and even make a little extra profit?

Hedging Your Portfolio
One common method to protect your portfolio in a down market is to add a hedge. A hedge is tool that you can use to offset some of your portfolio risk. For instance, you might have 70% of your money invested into large Australian stocks and 30% of your capital shorting the broad market. While this will limit your upside gains it will also reduce your downside losses and smooth out daily volatility.
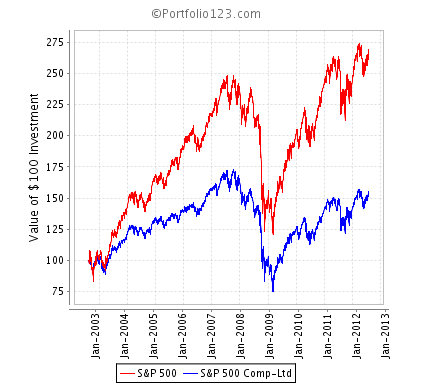
The first chart shows how an equal weighting strategy (red line) investing in the S&P 500 (USA) would have worked out against the market-cap weighted S&P 500 index (blue line). The annualized gain over the past 10 years is 10.48%. Max loss is 51% and the Sharpe Ratio (which measures gain against volatility) is 0.26.

The second chart employs a simple hedge where 66% of the fund is invested in the S&P 500 and 34% is short the S&P 500. The upside gain is now only 8% annually but the max loss is 34% and the Sharpe Ratio inched up to 0.27 because volatility is muted. Hedging doesn’t enhance gains but it lessens losses and smoothes out whip-saw trading.
There are many methods to hedge but one vehicle that makes the job easier to implement are Exchange Traded Funds or ETFs for short. ETFs are easy to trade funds that come in all sorts of sizes, shapes and flavors. The variety of ETFs allow you to adjust your hedge to suit your portfolio, sentiment and strategy.
- For example, you are invested in some high yielding Australian companies and you want a small hedge against a broad market fall. In this instance you can use 10-15% of your capital to short the ETFs that tract the largest stocks in the Australian market such as the ASX 50, 200 or 300.
- Or maybe you want a more direct hedge that inversely mirrors your investment. In that case you can choose the Russell High Dividend Australian Shares ETF (RDV).
- Or maybe you feel quite bearish about economy but still want a long position of high quality dividend stocks. In this instance you could have 50% of your portfolio in large high dividend companies and 50% of your capital shorting an Australian small cap index such as the iShares S&P/ASX Small Ordinaries (ISO) ETF. While half of your portfolio is long, you should still profit from a market drop.
There are many ways in which you can hedge. If you feel the market is soft or about to drop, choose defensive stocks such as utilities with strong yields for your long portfolio and short an ETF based on what you view as being weak. Your hedge could be a short position in property values, financial companies, energy, industrials or even the market of another country. This sort of hedge is similar to our next strategy…
Long/Short Portfolio
Similar to a hedge is a long/short portfolio. The difference here is that you want to equally divide your capital between long and short positions. If you choose long and short positions in similar sectors, industries and market capitalizations you should mitigate some of the bull/bear risk in the market. Thus, your portfolio should rise and fall based on how well you can pick good and bad companies relative to one another and you will not be unduly influenced by how well (or poor) the market is doing at any given moment.
Perhaps you have been following the Telstra (TLS) story and believe that they have a competitive advantage in the mobile markets and you believe that Optus (SGT) will lose market share. So you invest $10,000 into TLS and short SGT by $10,000. Over the last month Telstra is up 4% and Optus is pretty much flat. Therefore you earn a net 2%. This may seem like a bad investment since the market went up 4.5% during the same period of time. But consider what can happen in a down market…
- May 14th to June 1st the markets fell 5.4%. Yet the long TLS / short SGT strategy would have netted over 2% gain as Telstra stayed flat and SGT fell over 4%.
If you want to negate the effects of a down market and try your hand and choosing superior companies to invest in and inferior companies to bet against, the long/short portfolio is one method to do so.
Buying and Selling Put Options
There are other ways to profit from a bear market that does not involve going 100% short. Long investors may want to profit from an upmarket while still making some gains in the down market. Here is one other method that you can try and it involves selling options.
- If you purchase put options, you have the right to short sell at a certain price. If you sell put options, you agree to buy the stock if it falls to a certain price.
- If you purchase call options you are allowed to purchase the stock if it goes above a certain price. If you sell covered call options, you agree to sell your shares if it rises above a certain threshold.
We will sell cash-secured put options and covered call options. We will use TLS as an example and start with selling put options.
- Current prices is $3.76
- Options expire 4 months out
- Put options strike price is $3.50
- Options cost 7.5 cents per share
In this example we want to buy 10,000 shares of TLS if it pulls back in a down market. But why sit on cash and wait to see if this happens? Why not make money in the meantime? If it doesn’t pull back we still receive income for selling options. Either way we can do well.
First we need $35,000 set aside to purchase 10,000 shares if prices fall to $3.50 each. Next, we sell our options contracts and receive $750 of income. If prices stay above $3.50 over the next 4 months (less than 7% drop) we pocket the proceeds which amounts to 8.5% annually. If prices fall to $3.50 and we are forced to buy, we still make our full profit. Our breakeven point is at $3.425 which factors in the 7.5 cents of income we received. Prices can fall 9% in 4 months and we still breakeven. Any downside move below this is a loss. You need to remember that share prices will fall 14 cents on ex-dividend date.
Almost identical to this is the process of selling call options on stock you own. If you prefer to hold the stock (and thus receive any dividends while you wait), then you sell call options with the exact same strike price as above.
- You purchase 10,000 shares of TLS at $3.76. You sell call options with a strike price of $3.50 which means if share prices are above $3.50 in 4 months you sell your shares for $3.50 (regardless of what the prices is at that time). This option is only worth 27 cents. Are you only making 1 cent per share potential profit on this transaction? Remember that you are also in-line for a 14 cent per share dividend. Even after accounting for the future drop in share prices due to the dividend payment, you still have downside protection from selling your Call options. If you add option premiums and dividends together, your break-even point is $3.35 or an 11% drop. If prices stay above $3.50 you make 15 cents per share profit (1 cent option income plus 14 cents dividend income) while having downside protection.
Making Money in a Bear Market
Many investors think that the only way to make money in a bear market is to sell and go 100% short. While going ‘all in’ one direction can make you quick gains when correct, you also have to be proficient at timing the market. As well, many investors are long-term bulls and it goes against their natural instinct to fully short the market. The strategies outlined in this article are suitable for long investors that want to take advantage of a down market while still positioning for future upside moves.