Academy
  • Log in
  • Sign up
  • StockWatch
  • Lobby
  • Academy
  • Investing
    • Planning Your Investments Setting investment goals
    • 8 Steps to Financial Freedom
    • How to Get Out of Debt
    • Dollar Cost Averaging with Example Calculations
    • Which Credit Card Should I Get?
    • Can I Retire on 1 Million Dollars? Is it Enough?
    • Investment Vehicles Best way to invest your money?
    • How to Budget Your Money
    • Choosing a Finance Advisor
    • Asset Classes: Shares, property, fixed interest
    • The Magic of Compound Interest
  • Shares
    • Stock Market Investing and Share Market Tips
    • Short Selling Explained: What is Short Selling
    • How to Trade Like a Professional Trader
    • What are E Minis Futures? How do I Trade Them?
    • Diversification Learn how to diversify your portfolio
    • What Is Ethical Investing?
    • Creating a Trading Plan
    • The S&P/ASX 200 Index (XJO)
    • Choosing A Broker
    • Guard Your Portfolio With Defensive Stocks
    • How Much Do I Need To Invest In Shares
    • Investing VS Trading
    • What does ex dividend mean? How to ensure you receive your dividends
    • If I Could Only Invest In One Thing...
    • What Are Shares Dividends?
    • Dividend Imputation System & Franking Credits Explained Calculations
    • What is the 'Market'?
    • What Shares Should I Buy?
    • How to Buy Shares, placing an order
    • Building a Investment Portfolio Strategy
    • Trading the ASX 200 Index: ETFs, CFDs, Futures and Options
    • Creating a Trading System
    • Understanding the Share Language & Jargon of the Share Market
    • What are Income Stocks? Best Income Stocks for 2010
    • How To Pick Growth Stocks?
    • Wesfarmers (WES) vs Woolworths (WOW)
    • David Jones (DJS) VS Myer (MYR)
    • Benefits of Investing in Shares
    • How to Make Money In Shares
    • How to Treat Trading Like a Business
    • BHP vs RIO
    • Making Money In a Bear Market
    • Investing in Cloud Computing Stocks
    • High Dividend Stocks
    • Make Money Trading the Share Market
    • ANZ vs CBA vs NAB vs WBC
  • Funds
    • Managed Funds Choosing the best fund for you
    • S&P/ASX 200 ETFs: STW, IOZ, VAS
    • Managed Funds or Direct Shares
    • ETFs (Exchange Traded Funds)
    • Introduction to Index Funds
    • ETF Trading
  • Fundamental Analysis
    • Fundamental Analysis of Stocks: Qualitative Factors of the Company
    • Fundamental Analysis of Stocks: Qualitative Factors of the Industry
    • Fundamental Analysis: Quantitative Factors, Book and Price to Book Ratio
    • Fundamental Analysis: Quantitative Factors, Earnings Per Share (EPS)
    • Fundamental Analysis: Quantitative Factors, Price to Earning (P/E) and PEG
    • Fundamental Analysis: Quantitative Factors, Short Interest
    • Warren Buffett: A genius investor, a philanthropist, and a role model for citizens
    • Benjamin Graham: Father of value investing
    • Phillip Fisher
    • Peter Lynch
  • Technical Analysis
    • Charting
      • Technical Analysis: Charting: Line Chart
      • Technical Analysis: Charting: Bar Chart
      • Technical Analysis: How to Read a Candlestick Chart
      • Technical Analysis: How to Read Point and Figure Charts
      • Technical Analysis: How to Draw Trend Lines On A Stock Chart
      • Technical Analysis: What are Stock Gaps & How to Trade Them
      • Technical Analysis: How to Read & Trade Chart Patterns
    • Technical Analysis: The Secret of Moving Averages Explained
    • Learn How To Trade Support and Resistance Levels
    • Technical Analysis Indicators: Leading versus Lagging Indicators
    • Trend Following Indicators Part 1: What Is a Trend?
    • Trend Following Indicators Part 2: Trading The Average Directional Index (ADX)
    • Trend Following Indicators Part 3: The Directional Movement Index (DMI)
    • MACD Indicator Explained
    • Technical Analysis Momentum Indicators: ROC, Stochastic & RSI
    • The Relative Strength Index RSI Indicator Explained
    • Stochastic Indicator Explained
    • Momentum Following Indicators: The TRIX Indicator
    • Volume Following Indicators In Technical Analysis
    • Volume Indicators: On Balanced Volume (OBV) Indicator
    • Volume Indicators: Money Flow Index (MFI) Indicator Explained
    • Volume Following Indicators: Percentage Volume Oscillator (PVO) Indicator
    • Technical Analysis: Parabolic Stop and Reversal (PSAR) Indicator
    • Technical Analysis: Stop Loss & Trailing Stop Loss Orders
  • Commodities
    • Should I Invest in Gold? Pros and Cons of Precious Metal Investing
    • Should I Buy Gold Now?
    • Investing In Silver 7 Methods to Gain Exposure to Silver
  • Day Trading
    • Common Day Trading Myths and Lies Debunked
    • Day Trading Rules Part 1: Setup Long
    • Day Trading Rules Part 2: Setup Short
    • Buying and Selling With the Trend
    • Day Trading: The Art of Controlling Your Emotions Part 1
    • Day Trading: The Art of Controlling Your Emotions Part 2
    • Intermediate Setups and Creating a Bias Part 1
    • Intermediate Setups and Creating a Bias Part 2
    • The Art of Channel Trading
    • Day Trading Example: Walking Through a Trade – Part 1
    • Day Trading Example: Walking Through a Trade – Part 2
    • Can I Make Money Day Trading? How to Become a Day Trader?
    • Tracking the Market and Day Trading Your Stock
    • High Frequency Trading
    • What is a Trading Robot? Should I Use One to Trade?
  • Forex
    • How to Trade FOREX – Beginners Guide
    • Trading Forex
  • Derivatives
    • Options
      • Options Trading: Call Options Explained
      • Options Trading: Put Options Explained
      • Options Trading: Why Trade Options?
      • Components of an Option
      • Understanding Option Pricing Fundamentals
      • Options Trading Examples
      • Options Trading Strategies
      • Options Trading Risks
      • The Covered Call Strategy
      • Trading Options Seminars: What You Will Learn in a Teaser Seminar
    • CFDs
      • What are CFD's? Why Trade them?
      • CFD Types: Direct Market Access (DMA) VS Market Maker (MM) The Pros & Cons
      • CFD Margin Requirements Initial and Variation Margin.
      • CFD Trading: Calculating Overnight Interest Payments (Financing fees) with example
      • CFD Trading: CFD real life examples with calculations (Long & short)
      • The Pros & Cons of Trading CFDs
      • CFD Trading Risks: Learn the risks associated with trading CFDs
      • How to Choose the Best CFD Provider for You
      • CFD Trading Top 5 Trading Mistakes
      • CFD Tax Treatment
      • Learn How To Trade CFDs: Developing a system that should make us money
      • CFD Trading Example Flight Centre (FLT)

BHP vs RIO

  1. Articles
  2. Shares
  3. Bhp Vs Rio
16 October 2015
·
3 min read

9/14/2011

As mining stocks continue to be in the limelight – which one will come out on top as the winner in the ensuing battle? BHP or RIO?

The Skinny on BHP

BHP (BHP) is a massive company that is into production and distribution of petroleum, minerals, and mineral products. This includes oil and gas, aluminum, copper, silver, gold, diamonds, potash, and more.

The market capitalisation, or the value of all shares, sits around $200 billion dollars. What are some of the financial highlights of BHP? Their recent 1 year sales growth has almost tripled its 3 year average. The year over year earnings per share income is up 87.4%! Despite these high numbers, the price to earnings ratio is below the industry average at only 9.4 – and this is well below the 15 – 30 range of previous years.

The company has high net profit margins allowing it room to breathe. The 5 year net profit margin is 25.8% with the one year figure reaching up to 33.4%. Another measure of how well a company can turn a profit is with return on equity. The company generates 44.9% profit on their equity – which is higher than the 35.3% industry average.

The debt to equity ratio has dropped steadily and now sits at a healthy 0.29.

What about the future estimates? Next year’s sales are expected to grow at 12%, earnings at 18.4%, and the next 5 years at 20.46%. While these growth rates are decent, they are cooling somewhat from past years with some recent slashing of estimated earnings growth. This is going to be a hard stock to beat.

The Skinny on RIO

RIO Tinto Limited (RIO) is also a massive company, being one of the world’s largest international mining groups. They have their hands into almost everything from aluminum, copper, diamonds, coal, gold, iron ore, and more. The market capitalization of RIO is 120 billion dollars.

How does RIO compare? Sales growth has maintained strength and lies at 31.9% year over year growth. Earnings are up a whopping 143.1% year over year. Just like BHP, the price to earnings ratio is quite low for such high growth – sitting at 9.2.

Profit margins are comparable with the 5 year average lying at 20.7% and the most recent year at 28.4%. This is slightly below BHP but still well above industry averages. Their return on equity is at 29.5, which is below the industry average. It shows that they are not as efficient in use of equity.

The debt to equity ratio is identical to BHP, and they have aggressively reduced their long-term debt by two-thirds since 2007.

As we stack the two companies up they seem similar in valuations. What about future growth? Sales are expected to only climb 8% in 2012, and earnings by 8.6%. That being said, the next 5 years are anticipated as having a 40.62% pop in earnings despite forward earnings being dropped recently.

Mining Price Chart - BHP VS RIO
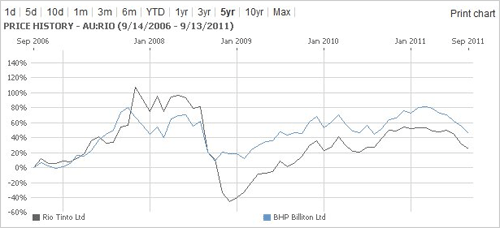
Mininig price chart - BHP VS RIO

As you might expect, these two stocks are trading fairly close together on the 5 year chart. RIO has higher tops and lower troughs while BHP is a more consistent mover over time. If you are seeking higher risk gains, RIO might be your pick, otherwise I prefer the price action of BHP.

Dividends

Our last look will be at dividends and payout ratios. RIO is paying out a 15% of their profits to shareholders for a 1.64% yield. BHP has a slightly higher yield at 2.7% with a payout ratio of 23%. I give the advantage to BHP for dividends, although with such a high return on equity they could likely earn more my re-investing the income into the company.

The Mining Winner?

I have to give the title belt to BHP. Their return on equity (roe) is very high, they have a good track record, decent future prospects and better price stability. The smallish dividend puts a little extra money in your pocket as this oil and mineral giant lumbers forth to put your investment dollars to work. RIO is no feather weight and a very strong #1 contender for the title, and if you want the potential for higher gains at the expense of higher volatility – then be my guest. My final recommendation must stick with the champ – BHP

shares
You May Also Like
  • Wesfarmers (WES) vs Woolworths (WOW)
  • David Jones (DJS) VS Myer (MYR)
  • ANZ vs CBA vs NAB vs WBC
  • Fundamental Analysis: Quantitative Factors, Book and Price to Book Ratio
  • What Shares Should I Buy?
About Privacy Contact v2.0.1
© 2025 The Domain Publisher Pty Ltd.
This website uses cookies to ensure you get the best experience on our website. Learn more about cookies