Academy
  • Log in
  • Sign up
  • StockWatch
  • Lobby
  • Academy
  • Investing
    • Planning Your Investments Setting investment goals
    • 8 Steps to Financial Freedom
    • How to Get Out of Debt
    • Dollar Cost Averaging with Example Calculations
    • Which Credit Card Should I Get?
    • Can I Retire on 1 Million Dollars? Is it Enough?
    • Investment Vehicles Best way to invest your money?
    • How to Budget Your Money
    • Choosing a Finance Advisor
    • Asset Classes: Shares, property, fixed interest
    • The Magic of Compound Interest
  • Shares
    • Stock Market Investing and Share Market Tips
    • Short Selling Explained: What is Short Selling
    • How to Trade Like a Professional Trader
    • What are E Minis Futures? How do I Trade Them?
    • Diversification Learn how to diversify your portfolio
    • What Is Ethical Investing?
    • Creating a Trading Plan
    • The S&P/ASX 200 Index (XJO)
    • Choosing A Broker
    • Guard Your Portfolio With Defensive Stocks
    • How Much Do I Need To Invest In Shares
    • Investing VS Trading
    • What does ex dividend mean? How to ensure you receive your dividends
    • If I Could Only Invest In One Thing...
    • What Are Shares Dividends?
    • Dividend Imputation System & Franking Credits Explained Calculations
    • What is the 'Market'?
    • What Shares Should I Buy?
    • How to Buy Shares, placing an order
    • Building a Investment Portfolio Strategy
    • Trading the ASX 200 Index: ETFs, CFDs, Futures and Options
    • Creating a Trading System
    • Understanding the Share Language & Jargon of the Share Market
    • What are Income Stocks? Best Income Stocks for 2010
    • How To Pick Growth Stocks?
    • Wesfarmers (WES) vs Woolworths (WOW)
    • David Jones (DJS) VS Myer (MYR)
    • Benefits of Investing in Shares
    • How to Make Money In Shares
    • How to Treat Trading Like a Business
    • BHP vs RIO
    • Making Money In a Bear Market
    • Investing in Cloud Computing Stocks
    • High Dividend Stocks
    • Make Money Trading the Share Market
    • ANZ vs CBA vs NAB vs WBC
  • Funds
    • Managed Funds Choosing the best fund for you
    • S&P/ASX 200 ETFs: STW, IOZ, VAS
    • Managed Funds or Direct Shares
    • ETFs (Exchange Traded Funds)
    • Introduction to Index Funds
    • ETF Trading
  • Fundamental Analysis
    • Fundamental Analysis of Stocks: Qualitative Factors of the Company
    • Fundamental Analysis of Stocks: Qualitative Factors of the Industry
    • Fundamental Analysis: Quantitative Factors, Book and Price to Book Ratio
    • Fundamental Analysis: Quantitative Factors, Earnings Per Share (EPS)
    • Fundamental Analysis: Quantitative Factors, Price to Earning (P/E) and PEG
    • Fundamental Analysis: Quantitative Factors, Short Interest
    • Warren Buffett: A genius investor, a philanthropist, and a role model for citizens
    • Benjamin Graham: Father of value investing
    • Phillip Fisher
    • Peter Lynch
  • Technical Analysis
    • Charting
      • Technical Analysis: Charting: Line Chart
      • Technical Analysis: Charting: Bar Chart
      • Technical Analysis: How to Read a Candlestick Chart
      • Technical Analysis: How to Read Point and Figure Charts
      • Technical Analysis: How to Draw Trend Lines On A Stock Chart
      • Technical Analysis: What are Stock Gaps & How to Trade Them
      • Technical Analysis: How to Read & Trade Chart Patterns
    • Technical Analysis: The Secret of Moving Averages Explained
    • Learn How To Trade Support and Resistance Levels
    • Technical Analysis Indicators: Leading versus Lagging Indicators
    • Trend Following Indicators Part 1: What Is a Trend?
    • Trend Following Indicators Part 2: Trading The Average Directional Index (ADX)
    • Trend Following Indicators Part 3: The Directional Movement Index (DMI)
    • MACD Indicator Explained
    • Technical Analysis Momentum Indicators: ROC, Stochastic & RSI
    • The Relative Strength Index RSI Indicator Explained
    • Stochastic Indicator Explained
    • Momentum Following Indicators: The TRIX Indicator
    • Volume Following Indicators In Technical Analysis
    • Volume Indicators: On Balanced Volume (OBV) Indicator
    • Volume Indicators: Money Flow Index (MFI) Indicator Explained
    • Volume Following Indicators: Percentage Volume Oscillator (PVO) Indicator
    • Technical Analysis: Parabolic Stop and Reversal (PSAR) Indicator
    • Technical Analysis: Stop Loss & Trailing Stop Loss Orders
  • Commodities
    • Should I Invest in Gold? Pros and Cons of Precious Metal Investing
    • Should I Buy Gold Now?
    • Investing In Silver 7 Methods to Gain Exposure to Silver
  • Day Trading
    • Common Day Trading Myths and Lies Debunked
    • Day Trading Rules Part 1: Setup Long
    • Day Trading Rules Part 2: Setup Short
    • Buying and Selling With the Trend
    • Day Trading: The Art of Controlling Your Emotions Part 1
    • Day Trading: The Art of Controlling Your Emotions Part 2
    • Intermediate Setups and Creating a Bias Part 1
    • Intermediate Setups and Creating a Bias Part 2
    • The Art of Channel Trading
    • Day Trading Example: Walking Through a Trade – Part 1
    • Day Trading Example: Walking Through a Trade – Part 2
    • Can I Make Money Day Trading? How to Become a Day Trader?
    • Tracking the Market and Day Trading Your Stock
    • High Frequency Trading
    • What is a Trading Robot? Should I Use One to Trade?
  • Forex
    • How to Trade FOREX – Beginners Guide
    • Trading Forex
  • Derivatives
    • Options
      • Options Trading: Call Options Explained
      • Options Trading: Put Options Explained
      • Options Trading: Why Trade Options?
      • Components of an Option
      • Understanding Option Pricing Fundamentals
      • Options Trading Examples
      • Options Trading Strategies
      • Options Trading Risks
      • The Covered Call Strategy
      • Trading Options Seminars: What You Will Learn in a Teaser Seminar
    • CFDs
      • What are CFD's? Why Trade them?
      • CFD Types: Direct Market Access (DMA) VS Market Maker (MM) The Pros & Cons
      • CFD Margin Requirements Initial and Variation Margin.
      • CFD Trading: Calculating Overnight Interest Payments (Financing fees) with example
      • CFD Trading: CFD real life examples with calculations (Long & short)
      • The Pros & Cons of Trading CFDs
      • CFD Trading Risks: Learn the risks associated with trading CFDs
      • How to Choose the Best CFD Provider for You
      • CFD Trading Top 5 Trading Mistakes
      • CFD Tax Treatment
      • Learn How To Trade CFDs: Developing a system that should make us money
      • CFD Trading Example Flight Centre (FLT)

Options Trading Examples

  1. Articles
  2. Derivatives
  3. Options
  4. Options Trading Example
18 July 2010
ยท
4 min read

Series 8 articles

  • Options Trading: Call Options Explained
  • Options Trading: Put Options Explained
  • Options Trading: Why Trade Options?
  • Components of an Option
  • Understanding Option Pricing Fundamentals
  • Options Trading Examples
  • Options Trading Strategies
  • Options Trading Risks

We will now walk through an actual example of trading a call option and a put option. Going through these steps will give us exposure to how a trade really works, and the profit versus risk of each scenario.

Expecting a Bull Market

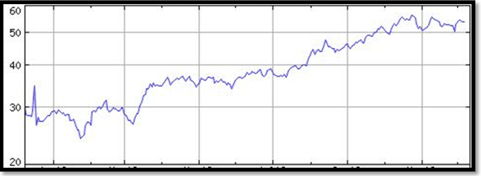
We all have those times when we get very bullish on a certain stock, or on the market as a whole. This trade will depict one of those times. The time frame is May 2009. The stock is Commonwealth Bank of Australia (CBA). The chart looks like this:

Our sentiment toward the market is bullish as we feel the worst of the economic downturn is over. We purchase call options on the stock CBA. The market has been volatile so this will inflate prices somewhat. We want to purchase a slightly ‘out of the money’ call option. Since the stock is trading at $37 we will purchase a contract with a strike price of $40. Also, we pick 6 months until expiration giving us enough time to let the stock rise.

This option will cost us $3.20 per share. Recall that each contract represents 1,000 shares so our outlay of cash is $3,200 plus transaction fees.

How Can We Can Profit?

Of course, we profit if the stock goes up. But under what circumstances will we gain?

  • To exercise our options the stock needs to rise above $40 per share
  • To profit by selling our contract, the option premium needs to rise quicker than time decay

How did the trade turn out?
Options trading with example

The stock rose to $50 by the end of the fifth month of holding our call options contract. Perhaps by this point we are slightly nervous and decide to sell. With one month of time remaining on our contract, how much will we gain?

  • If We Exercise the Contract

If we exercise the contract we gain the difference between the strike price and the current value of the shares. This relates to $10 per share profit. We essentially triple our investment and are now holding shares that we may need to sell on the open market.

  • If We Sell the Options Contract

By selling our options contract we profit a little extra from the time value in the options contract. As well, we do not need extra capital to convert the contract into shares. The call options contract would be worth $10.18 per share if sold this way. Multiplied by 1,000 shares, this equates to $10,180, or $180 dollars extra as opposed to exercising our option.

How Much Can We Lose?

If the stock did not break $40 per share by expiration date, we would lose the full $3,200 invested as the option would expire worthless. We cannot lose any more than that amount.

We can recoup some of our losses even if the stock did not break $40 dollars. Imagine that three months into the trade, the stock is trading at $37 still not having moved a penny. Our contract has lost much in the way of time value, but is still worth a total of $1,900. We have the choice of losing $1,300 immediately, but potentially saving a further loss.

Another devastating loss will occur if the stock moves quickly in the wrong direction. If the stock fell to $30 in one swoop, our contract would only be worth $850 even with six months still remaining of time value.

Although there are many ways our options contract can diminish in value, we can never lose more than what we paid in premiums as long as we are purchasing, and not writing options.

Expecting a Bear Market

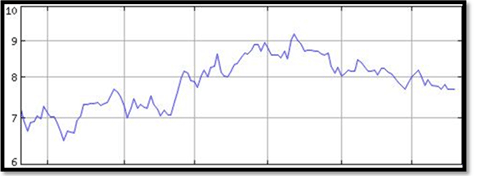
There are other times that we expect the market to fall. In these instances we can purchase put options that give us the right to buy at potentially lower prices, and sell at a higher price. The stock is Crown Limited (CWN). Here is the chart.

The price is roughly $8 per share and by September 1st, 2009, you see a small drop. You are anticipating a further drop due to a recessional after-shock so you purchase a very long term put options contract with a $5 strike price. The expiration date is December 12th, 2013, or four years away. The fair value of such an options contract is $1 per share or $1,000 total.

How We Can Profit?

We have four years to ride the market down. This gives us a massive time frame to trade in. We may profit if the price drops in the near term thus increasing the premium value of our put options contract, even if it has not hit the $5 strike price.

To exercise the contract, we profit by the amount the contract falls below the $5 strike price. If the contract fell to $3 by the end of our contract term, we would profit $2 per share which is double our investment.
The most we could gain is if the company fell to zero, whereby our options contract would be worth $5 per share, or five times the value of our investment.

How Can We Lose?

If the stock continues to go up, the share price will pull further and further away from the strike price thus decreasing our options premium.

If the stock stagnates, the time value portion of our put option contract will slowly be eroded.

Even if the stock goes down we may lose if:

  • we are trying to exercise our option but the price doesn’t go below $5 per share.
  • we try to sell the put option but the lost value of time exceeds the price drop.

If we do decide to exercise the option, $4 per share would be our breakeven point whereby we recoup $1 per share profit.

What Really Happened?

As of December 2009, the price rose, and then dropped. At one point our options contract dropped to being worth only 85 cents per share, or $850 total. This loss of $150 was reversed as the share prices began to drop thus raising our put options premium value.
Options trading example 2

Interestingly, although the theoretical option pricing calculator has this put options contract worth $1 per share, the market value is only 85 cents. This highlights how market expectation or implied volatility can influence options prices. Although, we still have four years to find out what will really happen.

Series: Previous | Next
derivatives options
You May Also Like
  • The Covered Call Strategy
About Privacy Contact v2.0.1
© 2025 The Domain Publisher Pty Ltd.
This website uses cookies to ensure you get the best experience on our website. Learn more about cookies