Academy
  • Log in
  • Sign up
  • StockWatch
  • Lobby
  • Academy
  • Investing
    • Planning Your Investments Setting investment goals
    • 8 Steps to Financial Freedom
    • How to Get Out of Debt
    • Dollar Cost Averaging with Example Calculations
    • Which Credit Card Should I Get?
    • Can I Retire on 1 Million Dollars? Is it Enough?
    • Investment Vehicles Best way to invest your money?
    • How to Budget Your Money
    • Choosing a Finance Advisor
    • Asset Classes: Shares, property, fixed interest
    • The Magic of Compound Interest
  • Shares
    • Stock Market Investing and Share Market Tips
    • Short Selling Explained: What is Short Selling
    • How to Trade Like a Professional Trader
    • What are E Minis Futures? How do I Trade Them?
    • Diversification Learn how to diversify your portfolio
    • What Is Ethical Investing?
    • Creating a Trading Plan
    • The S&P/ASX 200 Index (XJO)
    • Choosing A Broker
    • Guard Your Portfolio With Defensive Stocks
    • How Much Do I Need To Invest In Shares
    • Investing VS Trading
    • What does ex dividend mean? How to ensure you receive your dividends
    • If I Could Only Invest In One Thing...
    • What Are Shares Dividends?
    • Dividend Imputation System & Franking Credits Explained Calculations
    • What is the 'Market'?
    • What Shares Should I Buy?
    • How to Buy Shares, placing an order
    • Building a Investment Portfolio Strategy
    • Trading the ASX 200 Index: ETFs, CFDs, Futures and Options
    • Creating a Trading System
    • Understanding the Share Language & Jargon of the Share Market
    • What are Income Stocks? Best Income Stocks for 2010
    • How To Pick Growth Stocks?
    • Wesfarmers (WES) vs Woolworths (WOW)
    • David Jones (DJS) VS Myer (MYR)
    • Benefits of Investing in Shares
    • How to Make Money In Shares
    • How to Treat Trading Like a Business
    • BHP vs RIO
    • Making Money In a Bear Market
    • Investing in Cloud Computing Stocks
    • High Dividend Stocks
    • Make Money Trading the Share Market
    • ANZ vs CBA vs NAB vs WBC
  • Funds
    • Managed Funds Choosing the best fund for you
    • S&P/ASX 200 ETFs: STW, IOZ, VAS
    • Managed Funds or Direct Shares
    • ETFs (Exchange Traded Funds)
    • Introduction to Index Funds
    • ETF Trading
  • Fundamental Analysis
    • Fundamental Analysis of Stocks: Qualitative Factors of the Company
    • Fundamental Analysis of Stocks: Qualitative Factors of the Industry
    • Fundamental Analysis: Quantitative Factors, Book and Price to Book Ratio
    • Fundamental Analysis: Quantitative Factors, Earnings Per Share (EPS)
    • Fundamental Analysis: Quantitative Factors, Price to Earning (P/E) and PEG
    • Fundamental Analysis: Quantitative Factors, Short Interest
    • Warren Buffett: A genius investor, a philanthropist, and a role model for citizens
    • Benjamin Graham: Father of value investing
    • Phillip Fisher
    • Peter Lynch
  • Technical Analysis
    • Charting
      • Technical Analysis: Charting: Line Chart
      • Technical Analysis: Charting: Bar Chart
      • Technical Analysis: How to Read a Candlestick Chart
      • Technical Analysis: How to Read Point and Figure Charts
      • Technical Analysis: How to Draw Trend Lines On A Stock Chart
      • Technical Analysis: What are Stock Gaps & How to Trade Them
      • Technical Analysis: How to Read & Trade Chart Patterns
    • Technical Analysis: The Secret of Moving Averages Explained
    • Learn How To Trade Support and Resistance Levels
    • Technical Analysis Indicators: Leading versus Lagging Indicators
    • Trend Following Indicators Part 1: What Is a Trend?
    • Trend Following Indicators Part 2: Trading The Average Directional Index (ADX)
    • Trend Following Indicators Part 3: The Directional Movement Index (DMI)
    • MACD Indicator Explained
    • Technical Analysis Momentum Indicators: ROC, Stochastic & RSI
    • The Relative Strength Index RSI Indicator Explained
    • Stochastic Indicator Explained
    • Momentum Following Indicators: The TRIX Indicator
    • Volume Following Indicators In Technical Analysis
    • Volume Indicators: On Balanced Volume (OBV) Indicator
    • Volume Indicators: Money Flow Index (MFI) Indicator Explained
    • Volume Following Indicators: Percentage Volume Oscillator (PVO) Indicator
    • Technical Analysis: Parabolic Stop and Reversal (PSAR) Indicator
    • Technical Analysis: Stop Loss & Trailing Stop Loss Orders
  • Commodities
    • Should I Invest in Gold? Pros and Cons of Precious Metal Investing
    • Should I Buy Gold Now?
    • Investing In Silver 7 Methods to Gain Exposure to Silver
  • Day Trading
    • Common Day Trading Myths and Lies Debunked
    • Day Trading Rules Part 1: Setup Long
    • Day Trading Rules Part 2: Setup Short
    • Buying and Selling With the Trend
    • Day Trading: The Art of Controlling Your Emotions Part 1
    • Day Trading: The Art of Controlling Your Emotions Part 2
    • Intermediate Setups and Creating a Bias Part 1
    • Intermediate Setups and Creating a Bias Part 2
    • The Art of Channel Trading
    • Day Trading Example: Walking Through a Trade – Part 1
    • Day Trading Example: Walking Through a Trade – Part 2
    • Can I Make Money Day Trading? How to Become a Day Trader?
    • Tracking the Market and Day Trading Your Stock
    • High Frequency Trading
    • What is a Trading Robot? Should I Use One to Trade?
  • Forex
    • How to Trade FOREX – Beginners Guide
    • Trading Forex
  • Derivatives
    • Options
      • Options Trading: Call Options Explained
      • Options Trading: Put Options Explained
      • Options Trading: Why Trade Options?
      • Components of an Option
      • Understanding Option Pricing Fundamentals
      • Options Trading Examples
      • Options Trading Strategies
      • Options Trading Risks
      • The Covered Call Strategy
      • Trading Options Seminars: What You Will Learn in a Teaser Seminar
    • CFDs
      • What are CFD's? Why Trade them?
      • CFD Types: Direct Market Access (DMA) VS Market Maker (MM) The Pros & Cons
      • CFD Margin Requirements Initial and Variation Margin.
      • CFD Trading: Calculating Overnight Interest Payments (Financing fees) with example
      • CFD Trading: CFD real life examples with calculations (Long & short)
      • The Pros & Cons of Trading CFDs
      • CFD Trading Risks: Learn the risks associated with trading CFDs
      • How to Choose the Best CFD Provider for You
      • CFD Trading Top 5 Trading Mistakes
      • CFD Tax Treatment
      • Learn How To Trade CFDs: Developing a system that should make us money
      • CFD Trading Example Flight Centre (FLT)

Intermediate Setups and Creating a Bias Part 1

  1. Articles
  2. Day Trading
  3. Setups Bias
02 February 2014
ยท
5 min read

Series 11 articles

  • Common Day Trading Myths and Lies Debunked
  • Day Trading Rules Part 1: Setup Long
  • Day Trading Rules Part 2: Setup Short
  • Buying and Selling With the Trend
  • Day Trading: The Art of Controlling Your Emotions Part 1
  • Day Trading: The Art of Controlling Your Emotions Part 2
  • Intermediate Setups and Creating a Bias Part 1
  • Intermediate Setups and Creating a Bias Part 2
  • The Art of Channel Trading
  • Day Trading Example: Walking Through a Trade – Part 1
  • Day Trading Example: Walking Through a Trade – Part 2

Let’s have a quick review of our day trading rules learned thus far:

  • Wait for the high or the low of the previous bar to be taken out to trade in that direction as a trading trigger
  • Wait for 30 minutes or longer until you can create a trendline that defines the current trend. You can trade with the trend off trend bounces (or pullbacks) or you can wait for the trend to be broken to form a new trend
  • Sell when trendline is significantly broken.
  • Exit above the high of the previous bar.
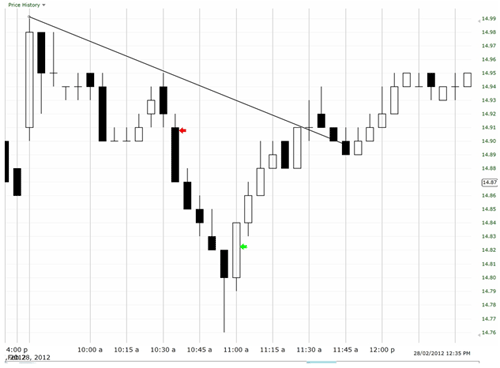
The chart above is Yahoo on February 29th, 2012. You watch the stock for the first hour of trading and at 10:35 you are able to draw a trendline and place a trade as prices take out a previous low. You might also note that at 10:05 it was also possible to draw a steeper trendline and short at an earlier point. We will stick to the trade at 10:30 though.

You can short at $14.90. The trade immediately shoots down fast. When prices fall at a much faster pace than your trendline you should be prepared for a little yo-yo action. Add this to your list of trading rules.

  • When prices plummet too far too fast there will often be an opposite reaction. In this case, trade using your two bar rule. Ride the wave and sell when a 5 minute bar rises above the previous bar. In this example we sell at $14.83 for a 7 cent profit.

Is there a way to have a stronger bias as to which direction the trade will go? Yes there is. On the 1 minute chart use a 10 period and 20 period ema (exponential moving average). The ema is a moving average that puts more weight on recent price action. I know we are not supposed to use the 1 minute chart but the moving averages will remove much of the noise while giving us a generalized signal.

What does the first 2 hours of trading look like on the 1 minute chart?
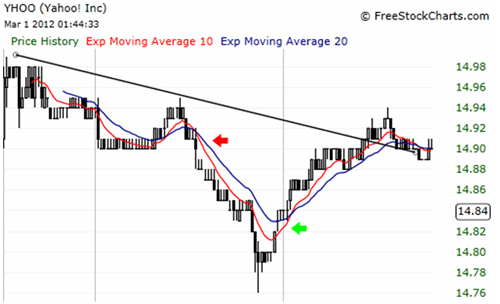


On the 1 minute chart we can still see our trendline along with the entry and exit points. As a general rule (and I do mean general as in not a law by any stretch), when the 10 period ema is above the 20 ema on the 1 minute chart you should be leaning toward long positions. When the 10 ema is below the 20 ema you should be leaning toward a short position.

Imagine that we entered based on the 5 minute chart and went short at $14.90. But we didn’t know when to exit. We didn’t discern that we should use our two bar rule. So we sit on this trade. Suddenly the 10 ema (red) crosses above the 20 ema (blue) on the 1 minute chart. Now we should lean towards a bull move.

Again, it is a suggestion and not a rule.

Alcoa Inc (AA)

The next stock is AA and you watch the first 30 minutes of trading. After 30 minutes you think you can draw a trendline.
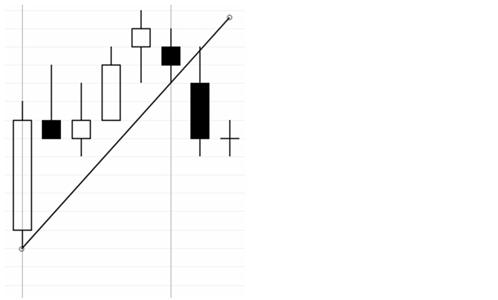


However, you never get a bounce off your trendline as prices now switch to trading lower. Your trendline is broken. Will you take this big black bar as a short trade? Maybe the stock is simply making a less steep trendline. What will you do?

You head over to the 1 minute charts with 10 and 20 period moving averages.
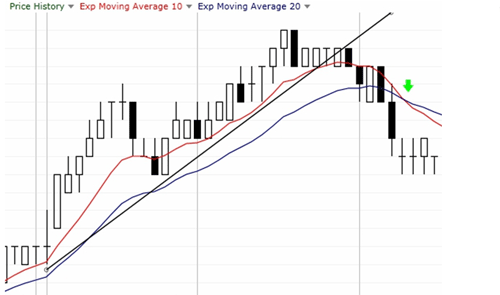


Will we go short? The grey vertical line that pierces the 8th to last bar is 10:00. Will we keep lowering our trendline or will we go short? Notice where the 10 ema crosses below the 20 ema where the green arrow is pointing. This is a further clue of a downtrend. We are creating a directional bias. Let’s go back to the 5 minute chart.
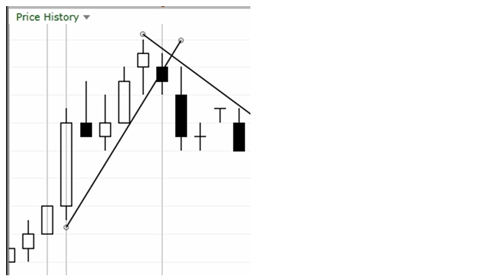


On the 5 minute chart we draw a new downtrend line. Now remember our trading rules, we wait for new lows to form and our preference is as close to our trendline as possible. Prices that have already dropped a significant amount may not give us enough profit and the odds of a reversal are higher. So we wait and if we miss out on an opportunity – so be it. In this instance prices do pop up to our pre-established trendline and we short when prices make a new low. The last bar on the diagram is where we can short using all of our rules. We did the following:

  • Waited for upwards trendline to be broken.
  • Looked at the 1 minute chart and waited for the 10 ema to fall below the 20 ema.
  • We went back to the 5 minute chart and waited for a new low but preferably on a pullback to our trendline.
  • We shorted when prices took out a new low using our two bar rule.

Okay, that puts us into the trade but how did it turn out and when do we sell? Let’s look at this on a bigger chart with 5 minute bars.
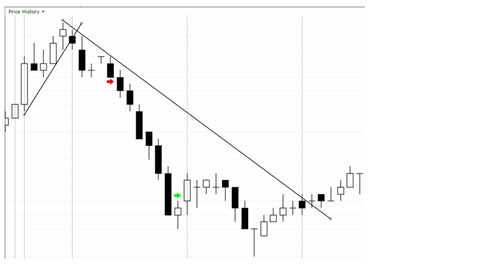
The first arrow is our entry based on the previous explanation. When do we sell? Well first of all - this was a great trade. Prices go lower and lower. The second green arrow shows one potential area to cover your position when the second white bar rises above the first. This would be your earliest entry. This sell trigger is based on the ‘prices moved too quickly away from your trendline and now you use the two bar rule’. You have another possible exit when the trendline is broken about one hour later (20 bars). Now this is quite a long time to hang onto a trade moving sideways and I probably wouldn’t stay in it that long.

Does our 1 minute charts provide any other clues using the moving average crossovers as to where our bias should lie?
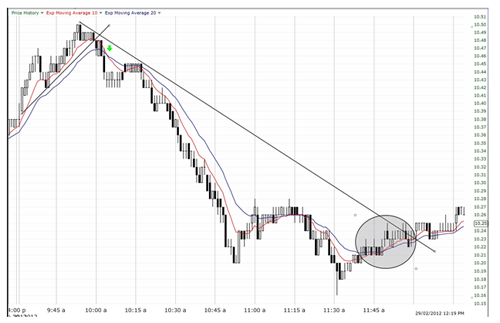


I drew the circle around the area where the 10 period ema rose above the 20 period ema on the 1 minute charts. We were already wondering if we should exit the trade as prices made a few thrusts down, the last hour traded sideways and now the moving averages on the 1 minute charts crossed over – it should push our bias towards an exit. So even 5 – 10 minutes before prices break our trendline we may have decided to exit.

Whether we used the two bar rule on the 5 minute chart, the broken trendline, or the moving average crossover on the 1 minute chart – it all adds up to similar sell points in this instance. We get roughly 16 cents of profit or $16 for every 100 shares traded.

Let’s consider one more trade using these techniques before we add a couple more techniques to the mix.

Mosaic Company (MOS)

The 5 minute chart pretty much speaks for itself. By about 10:30 when prices come back up to touch the trendline you are thinking of a short play. You short on the long black bar at $53.14 as the previous bars low is taken out. Around $57.79 - $57.80 the downward trend is broken up through and you exit your position with a $65 profit for every 100 shares traded.
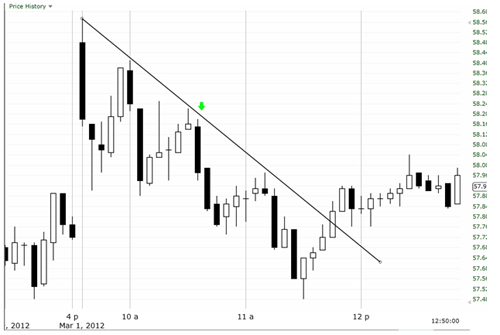


Does the 1 minute chart enhance our exit? Look below.
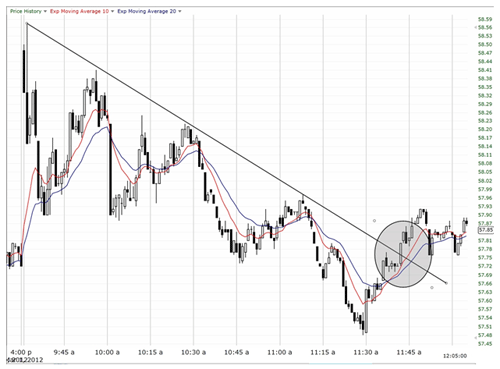


On every pullback the moving averages cross. This tells us that the trading is volatile and the moving averages crossing over will not be a great exit signal. We wait until prices break above the trendline as we passively note that the 10 ema is above the 20 ema on our exit. Click here for Intermediate Setups and Creating a Bias PART 2

Series: Previous | Next
day trading short selling
About Privacy Contact v2.0.1
© 2025 The Domain Publisher Pty Ltd.
This website uses cookies to ensure you get the best experience on our website. Learn more about cookies