Academy
  • Log in
  • Sign up
  • StockWatch
  • Lobby
  • Academy
  • Investing
    • Planning Your Investments Setting investment goals
    • 8 Steps to Financial Freedom
    • How to Get Out of Debt
    • Dollar Cost Averaging with Example Calculations
    • Which Credit Card Should I Get?
    • Can I Retire on 1 Million Dollars? Is it Enough?
    • Investment Vehicles Best way to invest your money?
    • How to Budget Your Money
    • Choosing a Finance Advisor
    • Asset Classes: Shares, property, fixed interest
    • The Magic of Compound Interest
  • Shares
    • Stock Market Investing and Share Market Tips
    • Short Selling Explained: What is Short Selling
    • How to Trade Like a Professional Trader
    • What are E Minis Futures? How do I Trade Them?
    • Diversification Learn how to diversify your portfolio
    • What Is Ethical Investing?
    • Creating a Trading Plan
    • The S&P/ASX 200 Index (XJO)
    • Choosing A Broker
    • Guard Your Portfolio With Defensive Stocks
    • How Much Do I Need To Invest In Shares
    • Investing VS Trading
    • What does ex dividend mean? How to ensure you receive your dividends
    • If I Could Only Invest In One Thing...
    • What Are Shares Dividends?
    • Dividend Imputation System & Franking Credits Explained Calculations
    • What is the 'Market'?
    • What Shares Should I Buy?
    • How to Buy Shares, placing an order
    • Building a Investment Portfolio Strategy
    • Trading the ASX 200 Index: ETFs, CFDs, Futures and Options
    • Creating a Trading System
    • Understanding the Share Language & Jargon of the Share Market
    • What are Income Stocks? Best Income Stocks for 2010
    • How To Pick Growth Stocks?
    • Wesfarmers (WES) vs Woolworths (WOW)
    • David Jones (DJS) VS Myer (MYR)
    • Benefits of Investing in Shares
    • How to Make Money In Shares
    • How to Treat Trading Like a Business
    • BHP vs RIO
    • Making Money In a Bear Market
    • Investing in Cloud Computing Stocks
    • High Dividend Stocks
    • Make Money Trading the Share Market
    • ANZ vs CBA vs NAB vs WBC
  • Funds
    • Managed Funds Choosing the best fund for you
    • S&P/ASX 200 ETFs: STW, IOZ, VAS
    • Managed Funds or Direct Shares
    • ETFs (Exchange Traded Funds)
    • Introduction to Index Funds
    • ETF Trading
  • Fundamental Analysis
    • Fundamental Analysis of Stocks: Qualitative Factors of the Company
    • Fundamental Analysis of Stocks: Qualitative Factors of the Industry
    • Fundamental Analysis: Quantitative Factors, Book and Price to Book Ratio
    • Fundamental Analysis: Quantitative Factors, Earnings Per Share (EPS)
    • Fundamental Analysis: Quantitative Factors, Price to Earning (P/E) and PEG
    • Fundamental Analysis: Quantitative Factors, Short Interest
    • Warren Buffett: A genius investor, a philanthropist, and a role model for citizens
    • Benjamin Graham: Father of value investing
    • Phillip Fisher
    • Peter Lynch
  • Technical Analysis
    • Charting
      • Technical Analysis: Charting: Line Chart
      • Technical Analysis: Charting: Bar Chart
      • Technical Analysis: How to Read a Candlestick Chart
      • Technical Analysis: How to Read Point and Figure Charts
      • Technical Analysis: How to Draw Trend Lines On A Stock Chart
      • Technical Analysis: What are Stock Gaps & How to Trade Them
      • Technical Analysis: How to Read & Trade Chart Patterns
    • Technical Analysis: The Secret of Moving Averages Explained
    • Learn How To Trade Support and Resistance Levels
    • Technical Analysis Indicators: Leading versus Lagging Indicators
    • Trend Following Indicators Part 1: What Is a Trend?
    • Trend Following Indicators Part 2: Trading The Average Directional Index (ADX)
    • Trend Following Indicators Part 3: The Directional Movement Index (DMI)
    • MACD Indicator Explained
    • Technical Analysis Momentum Indicators: ROC, Stochastic & RSI
    • The Relative Strength Index RSI Indicator Explained
    • Stochastic Indicator Explained
    • Momentum Following Indicators: The TRIX Indicator
    • Volume Following Indicators In Technical Analysis
    • Volume Indicators: On Balanced Volume (OBV) Indicator
    • Volume Indicators: Money Flow Index (MFI) Indicator Explained
    • Volume Following Indicators: Percentage Volume Oscillator (PVO) Indicator
    • Technical Analysis: Parabolic Stop and Reversal (PSAR) Indicator
    • Technical Analysis: Stop Loss & Trailing Stop Loss Orders
  • Commodities
    • Should I Invest in Gold? Pros and Cons of Precious Metal Investing
    • Should I Buy Gold Now?
    • Investing In Silver 7 Methods to Gain Exposure to Silver
  • Day Trading
    • Common Day Trading Myths and Lies Debunked
    • Day Trading Rules Part 1: Setup Long
    • Day Trading Rules Part 2: Setup Short
    • Buying and Selling With the Trend
    • Day Trading: The Art of Controlling Your Emotions Part 1
    • Day Trading: The Art of Controlling Your Emotions Part 2
    • Intermediate Setups and Creating a Bias Part 1
    • Intermediate Setups and Creating a Bias Part 2
    • The Art of Channel Trading
    • Day Trading Example: Walking Through a Trade – Part 1
    • Day Trading Example: Walking Through a Trade – Part 2
    • Can I Make Money Day Trading? How to Become a Day Trader?
    • Tracking the Market and Day Trading Your Stock
    • High Frequency Trading
    • What is a Trading Robot? Should I Use One to Trade?
  • Forex
    • How to Trade FOREX – Beginners Guide
    • Trading Forex
  • Derivatives
    • Options
      • Options Trading: Call Options Explained
      • Options Trading: Put Options Explained
      • Options Trading: Why Trade Options?
      • Components of an Option
      • Understanding Option Pricing Fundamentals
      • Options Trading Examples
      • Options Trading Strategies
      • Options Trading Risks
      • The Covered Call Strategy
      • Trading Options Seminars: What You Will Learn in a Teaser Seminar
    • CFDs
      • What are CFD's? Why Trade them?
      • CFD Types: Direct Market Access (DMA) VS Market Maker (MM) The Pros & Cons
      • CFD Margin Requirements Initial and Variation Margin.
      • CFD Trading: Calculating Overnight Interest Payments (Financing fees) with example
      • CFD Trading: CFD real life examples with calculations (Long & short)
      • The Pros & Cons of Trading CFDs
      • CFD Trading Risks: Learn the risks associated with trading CFDs
      • How to Choose the Best CFD Provider for You
      • CFD Trading Top 5 Trading Mistakes
      • CFD Tax Treatment
      • Learn How To Trade CFDs: Developing a system that should make us money
      • CFD Trading Example Flight Centre (FLT)

Day Trading Rules Part 2: Setup Short

  1. Articles
  2. Day Trading
  3. Setup Short
27 January 2014
ยท
4 min read

Series 11 articles

  • Common Day Trading Myths and Lies Debunked
  • Day Trading Rules Part 1: Setup Long
  • Day Trading Rules Part 2: Setup Short
  • Buying and Selling With the Trend
  • Day Trading: The Art of Controlling Your Emotions Part 1
  • Day Trading: The Art of Controlling Your Emotions Part 2
  • Intermediate Setups and Creating a Bias Part 1
  • Intermediate Setups and Creating a Bias Part 2
  • The Art of Channel Trading
  • Day Trading Example: Walking Through a Trade – Part 1
  • Day Trading Example: Walking Through a Trade – Part 2

The first part of this two-part series discussed our first simply day-trading rule: only initiate a long position when the current bar rises above the previous bar. Keep in mind that this is a trading trigger – it is independent of our bias as to whether the stock is expected to go up or down. This is a focused and narrow time-frame rule to be used on a 5 minute chart. But what is our second basic entry rule when shorting a stock? It is the exact opposite of our previous rule.

Basic Short Entry Rule #2: Only enter a short position when the bar you want to trade goes lower than the previous bar. Look at the previous two charts to see all the wonderful entries you could have had by following this one simple rule. There are 6 to 7 profitable entries on each chart even if this was the only rule you used to enter trades. Of course, you need to know when to get out of a position – or when to exit - and that will be discussed in a later article.

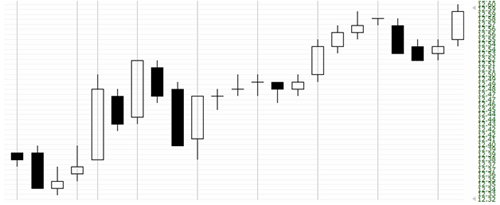
The chart below is Ford and each candle represent 5 minutes of trading. For this exercise we do not yet have a long or short bias. It can trade in either direction. As soon as the bar goes above the high of the previous bar – pretend that you bought or entered into a long position. If the bar dips below the lowest point of the previous candle – imagine you enter a short position.

You are concentrating on two bars at a time when deciding to use this trigger or not. In this example you will only hold for the duration of that one bar (or you exit at the top of the solid part or the white bar or the bottom of the candle body of the black bar – but not the wicks since these are not closing prices).
Basic Short Entry Rule #2

How many trades could you have broke-even or made money on by following that rule? You should have about 12 or so trades where you could have made money and about three or four where you did not. This one simple rule puts the statistical odds in your favor of being profitable. For instance, imagine you were trading Ford with 1,000 shares and your goal was to take two pennies profit with a stop-loss at two pennies. You should have grossed a profit of $140 (figures may vary somewhat).

Again, don’t walk up to a stock and blindly trade the moment prices go above or below the previous bar. Consider this to be a ‘junior trader’ trigger but we still do not know whether we are biased long or short and we do not have an actual setup (or trading pattern).

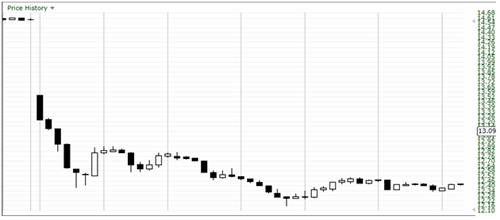
Earnings can be a particularly exciting time to trade as prices become volatile and quick moving. Avis Budget Group reported earnings and it wasn’t well received. The chart below uses candles of 2 minutes each. Of course the most profitable move would be to short the stock during its morning drop, but for this example we will assume that we had a bias to buy.

In general you should follow the trend, but the key here is to illustrate how these two rules will add a layer of protection even if you make the mistake of buying a falling stock (which should be avoided until you are proficient at trend-trading).
Basic Short Entry Rule #2

The chart below is merely a closeup of the first 14 bars of the above Avis chart. Notice how the stock falls and keeps bouncing lower. Let’s focus on the early part of the morning with our mistaken buying bias.

Basic Short Entry Rule #2

When is the first opportunity you would have to buy? Prices are as high as $13.54 and over the next 10 minutes they drop down to a low of $12.37. If you were trading 100 shares this would be a loss of $117. The first opportunity you have to buy is with the first white bar as it goes above the high of the previous bar. You would buy at $12.56 and the bar went as high as $12.87 or $31 profit on 100 shares.

As a new trader, you should only buy when a new high is formed and only short when a new low is formed when comparing it to the previous bar. This is true regardless of what time frame you are trading. Never try to guess ‘how low is low enough’ and buy when prices are falling making new lows.

Looking back, the majority of bad entries came when I felt prices had fallen far enough coupled the compounding stupidity of averaging down – which is buying more and more shares while prices dropped. The adage is true that ‘the market can stay irrational longer than you can stay liquid’. ‘Never try to catch a falling knife’.

*Tip: The only time you should ignore this rule is if you show up late to the party. If one bar spikes from $10 to $11 you should not wait for the following bar to go above $11 to buy. The trade got away from you and the risk is now too high. It is better to avoid this two-bar rule when the first bar is extremely long.

This completes the two-part article series on simple trading triggers. To become a well-rounded trader you should first have a bias as to whether the stock is expected to rise or fall, and have exit strategies. You can read more on this in other articles at this site.

Series: Previous | Next
day trading short selling
About Privacy Contact v2.0.1
© 2025 The Domain Publisher Pty Ltd.
This website uses cookies to ensure you get the best experience on our website. Learn more about cookies